


Customer churn canvas
This canvas helps you better understand your customer churn. It is primarily designed for subscription-based churn, but can also be used for customers who stop being repeat buyers of your product/service. It gives you both the leading indicators of churn and an analysis of why it happened. Outputs from a churn review may require significant changes to a product roadmap or service improvement backlog. Churn analysis is a strategic exercise and should have strong representation from across your business, this includes your product team.
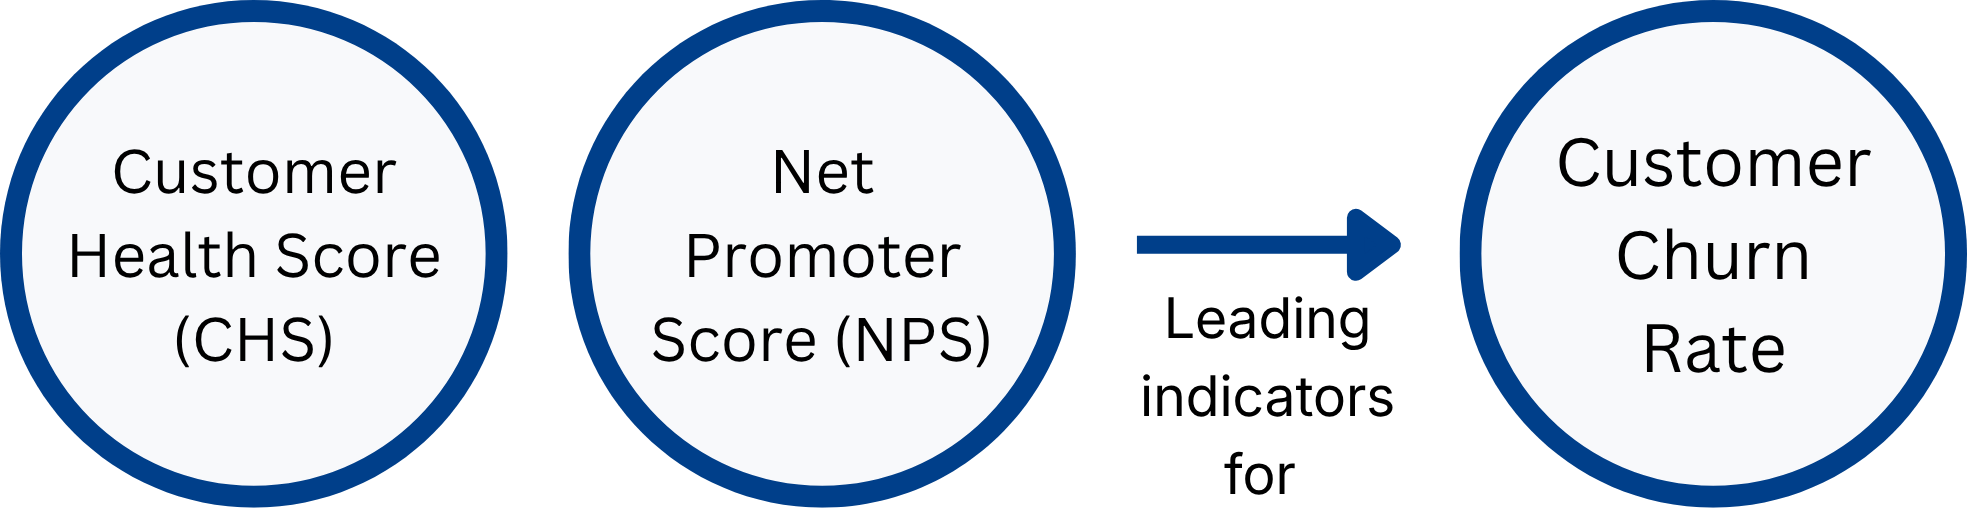
The importance of leading indicators
Leading indicators represent signals that you can see before churn happens. This stops you from being reactive. Aim to catch signals of poor health as early as possible. For example, a high number of support calls about something not working (failure demand) and calls seeking more from the product (value demand) could be early indicators of potential churn. Account contraction, although useful, may suggest the customer has not been happy for some time. You still want to track this, but it would have been better to have had faster signals in place. These leading indicators form an overall Customer Health Score (CHS) that will be a good indicator of future churn.
The impact of churn
Where a customer churns to a competitor or decides to create their own solution, you may never get them back. They may publicly discuss their dissatisfaction, which could impact future sales. Worse still, they could actively promote a competitor against you.
Churn review period
The canvas starts by capturing your formal review period, which reflects the full churn analysis below.
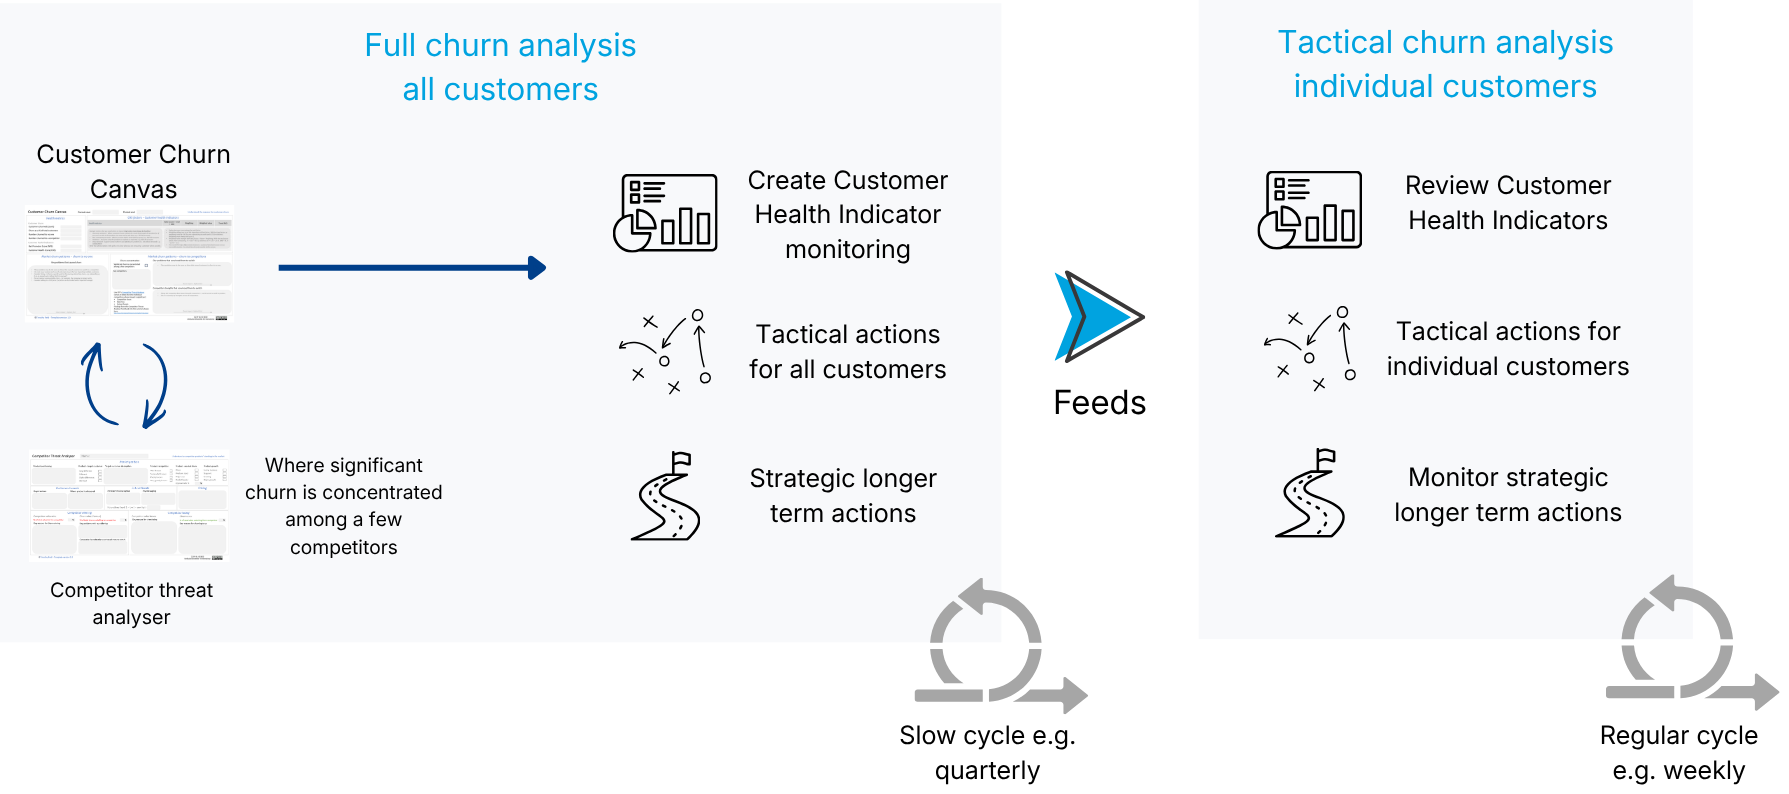
Full churn analysis - Looking for broader trends and making strategic recommendations to improve your product or service. You should consider more detailed post-mortems on who actually left. Due to the overhead of this activity, you should carefully consider how often you run this, for example, quarterly. You may wish to increase the frequency of formal churn analysis if you are in an unhealthy position. For example, you may run this quarterly by default, but move to monthly to address a major downturn.
Tactical account-based analysis - Discuss specific unhappy accounts that represent churn risk on a regular basis. The circumstances may be individual to these. You should consider meeting on a weekly cadence (e.g., every 1 or 2 weeks) if you have major client issues. You may be discussing the health of the leading indicators here, which represent your overall CHS score.
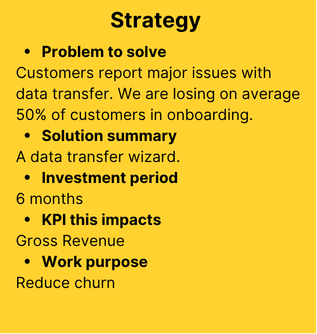
Strategy items (for non-tactical solutions)
In some cases, you may need a significant intervention to reduce churn. Below shows a lightweight method for capturing a strategy. These strategy items should be prioritised. You may have multiple possible solutions. Create the solution options where they are most likely to work/lowest cost. If one solution clearly meets these criteria, you may simply create a single strategy item.
Customer Churn Canvas
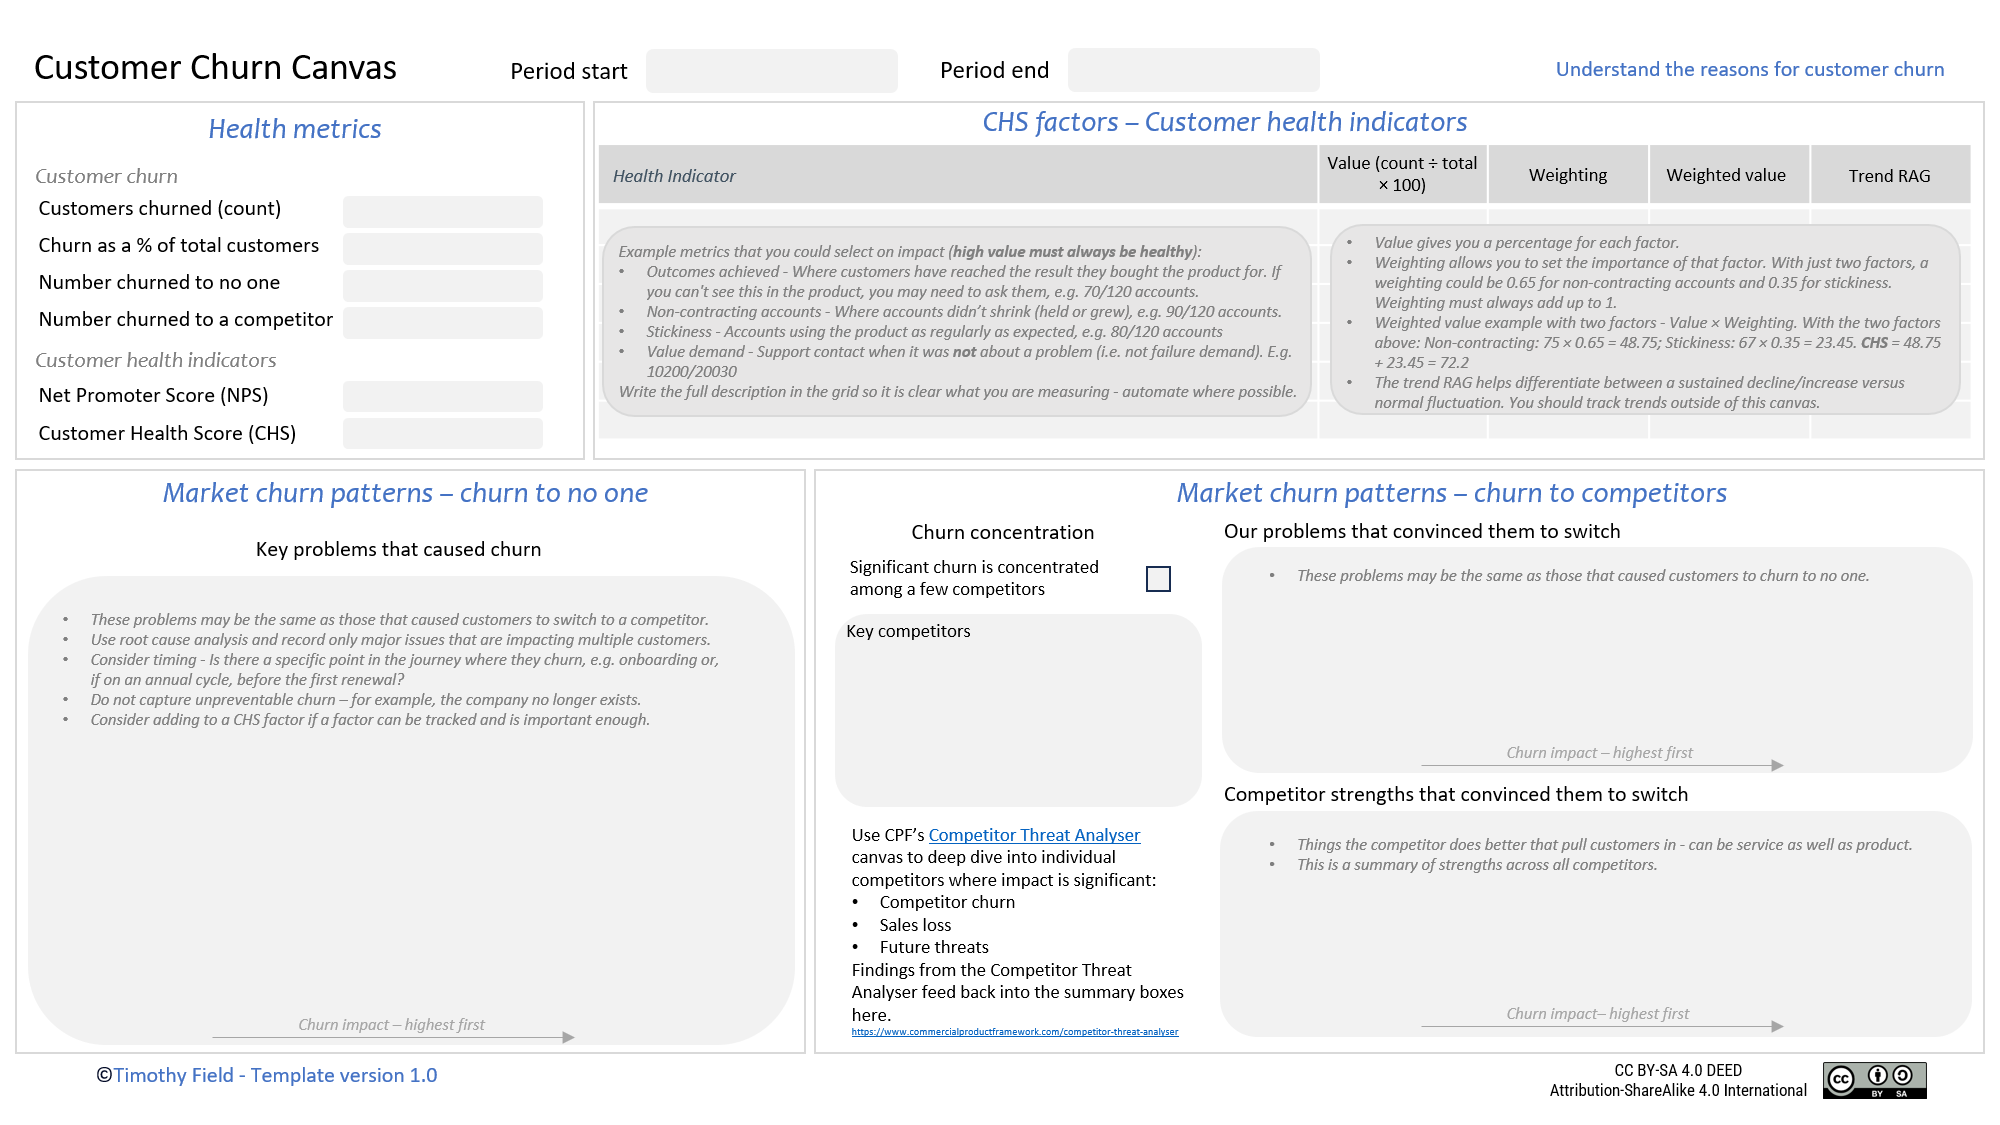
Feel free to recreate the canvas in a tool of your choice. Please attribute the author (Timothy Field), the source of the canvas (this webpage) and add the CreativeCommons BY-SA license
Health metrics
Health metrics provide a high-level view of health and can be used as Key Performance Indicators (KPIs). If churn is not a major issue, you may be monitoring these KPIs but not actively working on strategies to reduce it. This is important, as an organisation will have limited capacity and should not automatically take on work here. This prioritisation is considered in the Strategic Direction stage of the Commercial Product Framework.
Customer Churn
When considering the impact of churn, you may also wish to look at revenue loss. For example, 2 very large customers have left, creating a major impact on your organisation.
Customers churned.
Churn as a %age of overall customers.
Number churned to no one.
Number churned to a competitor.
Customer health indicators
This section includes Net Promoter Score (NPS), how likely a customer is to recommend you, and Customer Health Score (CHS), an internal view of customer health.
Net Promoter Score (NPS)
The likelihood of a customer recommending you on a scale of 0 to 10. A poor NPS score can lead to churn. In addition, you may experience further damage from unhappy customers sharing their negative experiences. You should seek further information and insights where they are scoring very low. Ask the following question to determine your NPS Score:
How likely are you to recommend us to someone?
Scores 0-6 are considered negative and may be at risk of churn.
7-8 are considered neutral.
9-10 are considered positive, with a high likelihood that they will personally recommend you.
The NPS score calculation ignores the neutrals.
NPS is calculated like this:
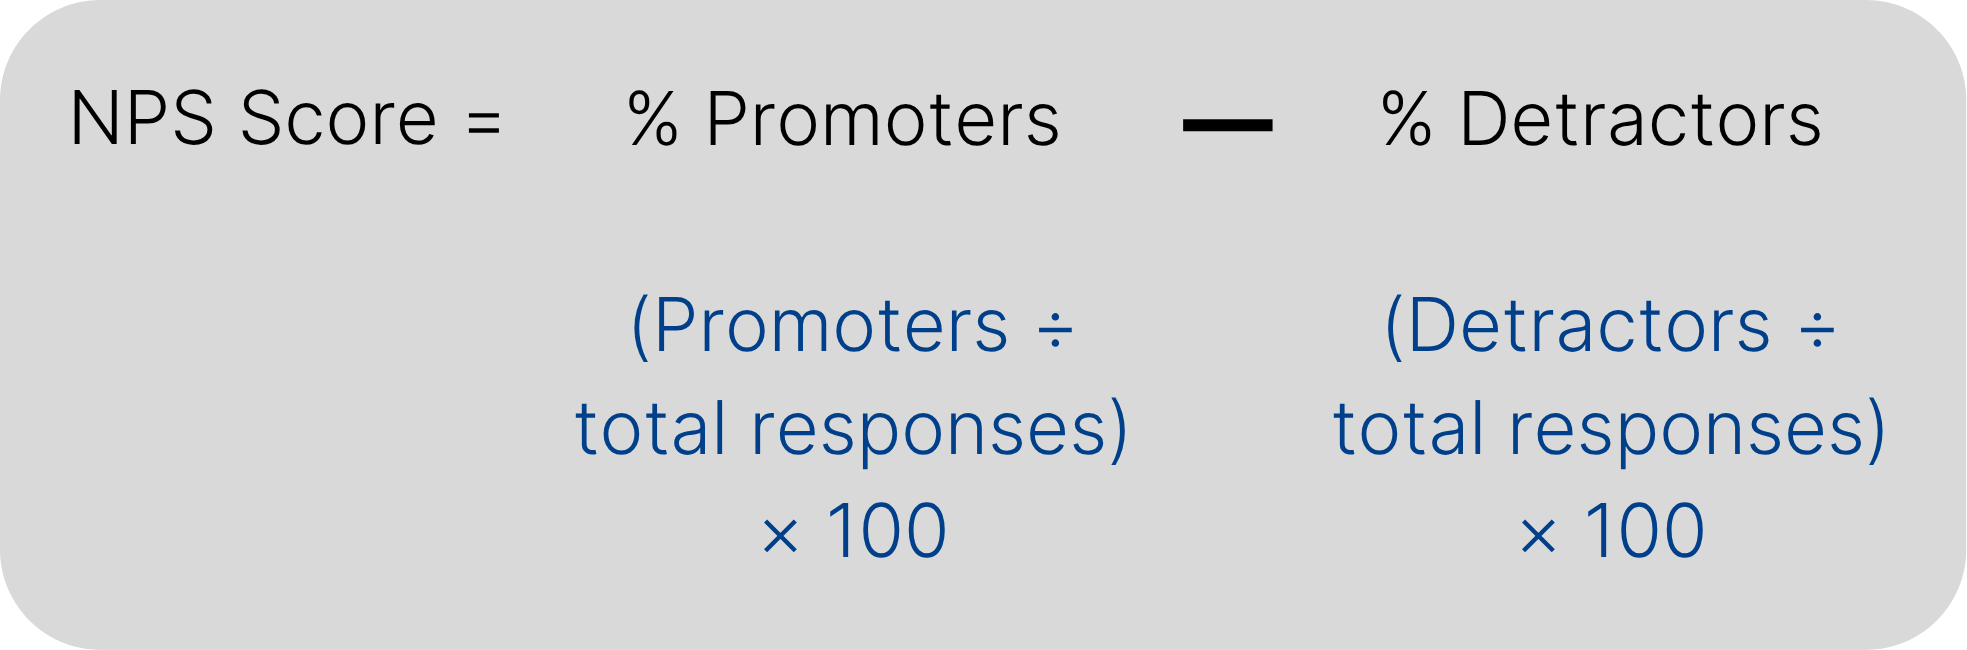
If detractors outnumber promoters, you may end up with a negative score, e.g. -20. Note: this is not a percentage but a score that can vary from -100 to 100.
The traditional approach was to send an NPS feedback request annually. This may be suboptimal as it represents a very slow feedback loop. Consider going faster, such as within quarterly or biannual relationship surveys.
When you go more regularly, be careful to act on feedback. There will be nothing more annoying to a customer than continually asking them if they are happy with you, then doing nothing about their concerns. At a minimum, let them know the reasons you are not going to act if they have raised serious concerns. To avoid capacity issues, you may wish to focus on accounts with poor NPS and only then seek detailed feedback from them.
Customer Health Score (CHS)
This is an internal indicator of customer health that you can gather yourself. It is a combination of factors that lets you know how well you are doing. You can gather this information without contacting the customer and proactively look for weaknesses in your product and service. This can be gathered more regularly than a Net Promoter Score (NPS). The metric on the canvas is an aggregation of all CHS factors. The full description on how to create this is in the CHS factors tab.
| Health Indicator | Value (count ÷ total × 100) | Weighting | Weighted value | Trend RAG |
|---|---|---|---|---|
| Outcomes achieved (customers reaching the result they bought the product for) | 58 (70 ÷ 120) | 0.35 | 20.3 | Amber |
| Non-contracting accounts (held or grew, i.e. didn't shrink) | 75 (90 ÷ 120) | 0.30 | 22.5 | Green |
| Stickiness (using the product as regularly as expected) | 67 (80 ÷ 120) | 0.20 | 13.4 | Green |
| Value demand (support contact not driven by a problem) | 51 (10,200 ÷ 20,030) | 0.15 | 7.7 | Red |
| Total Customer Health Score (CHS) | 1.00 | 63.9 |
CHS Factors
Customer Health Score (CHS) factors are the basis for the overall CHS score. The canvas contains a grid to capture this information. When monitoring customer health, you should consider trends and should capture them outside of the canvas. CHS factors are a combination of:
Factors that are direct causes of churn - these are already impacting you, and you have good evidence of this.
Factors that represent obvious churn risk - these may not be impacting you yet, or you may not have much evidence, but you know that they will. For example, low usage of a SaaS product is an obvious high-risk churn factor.
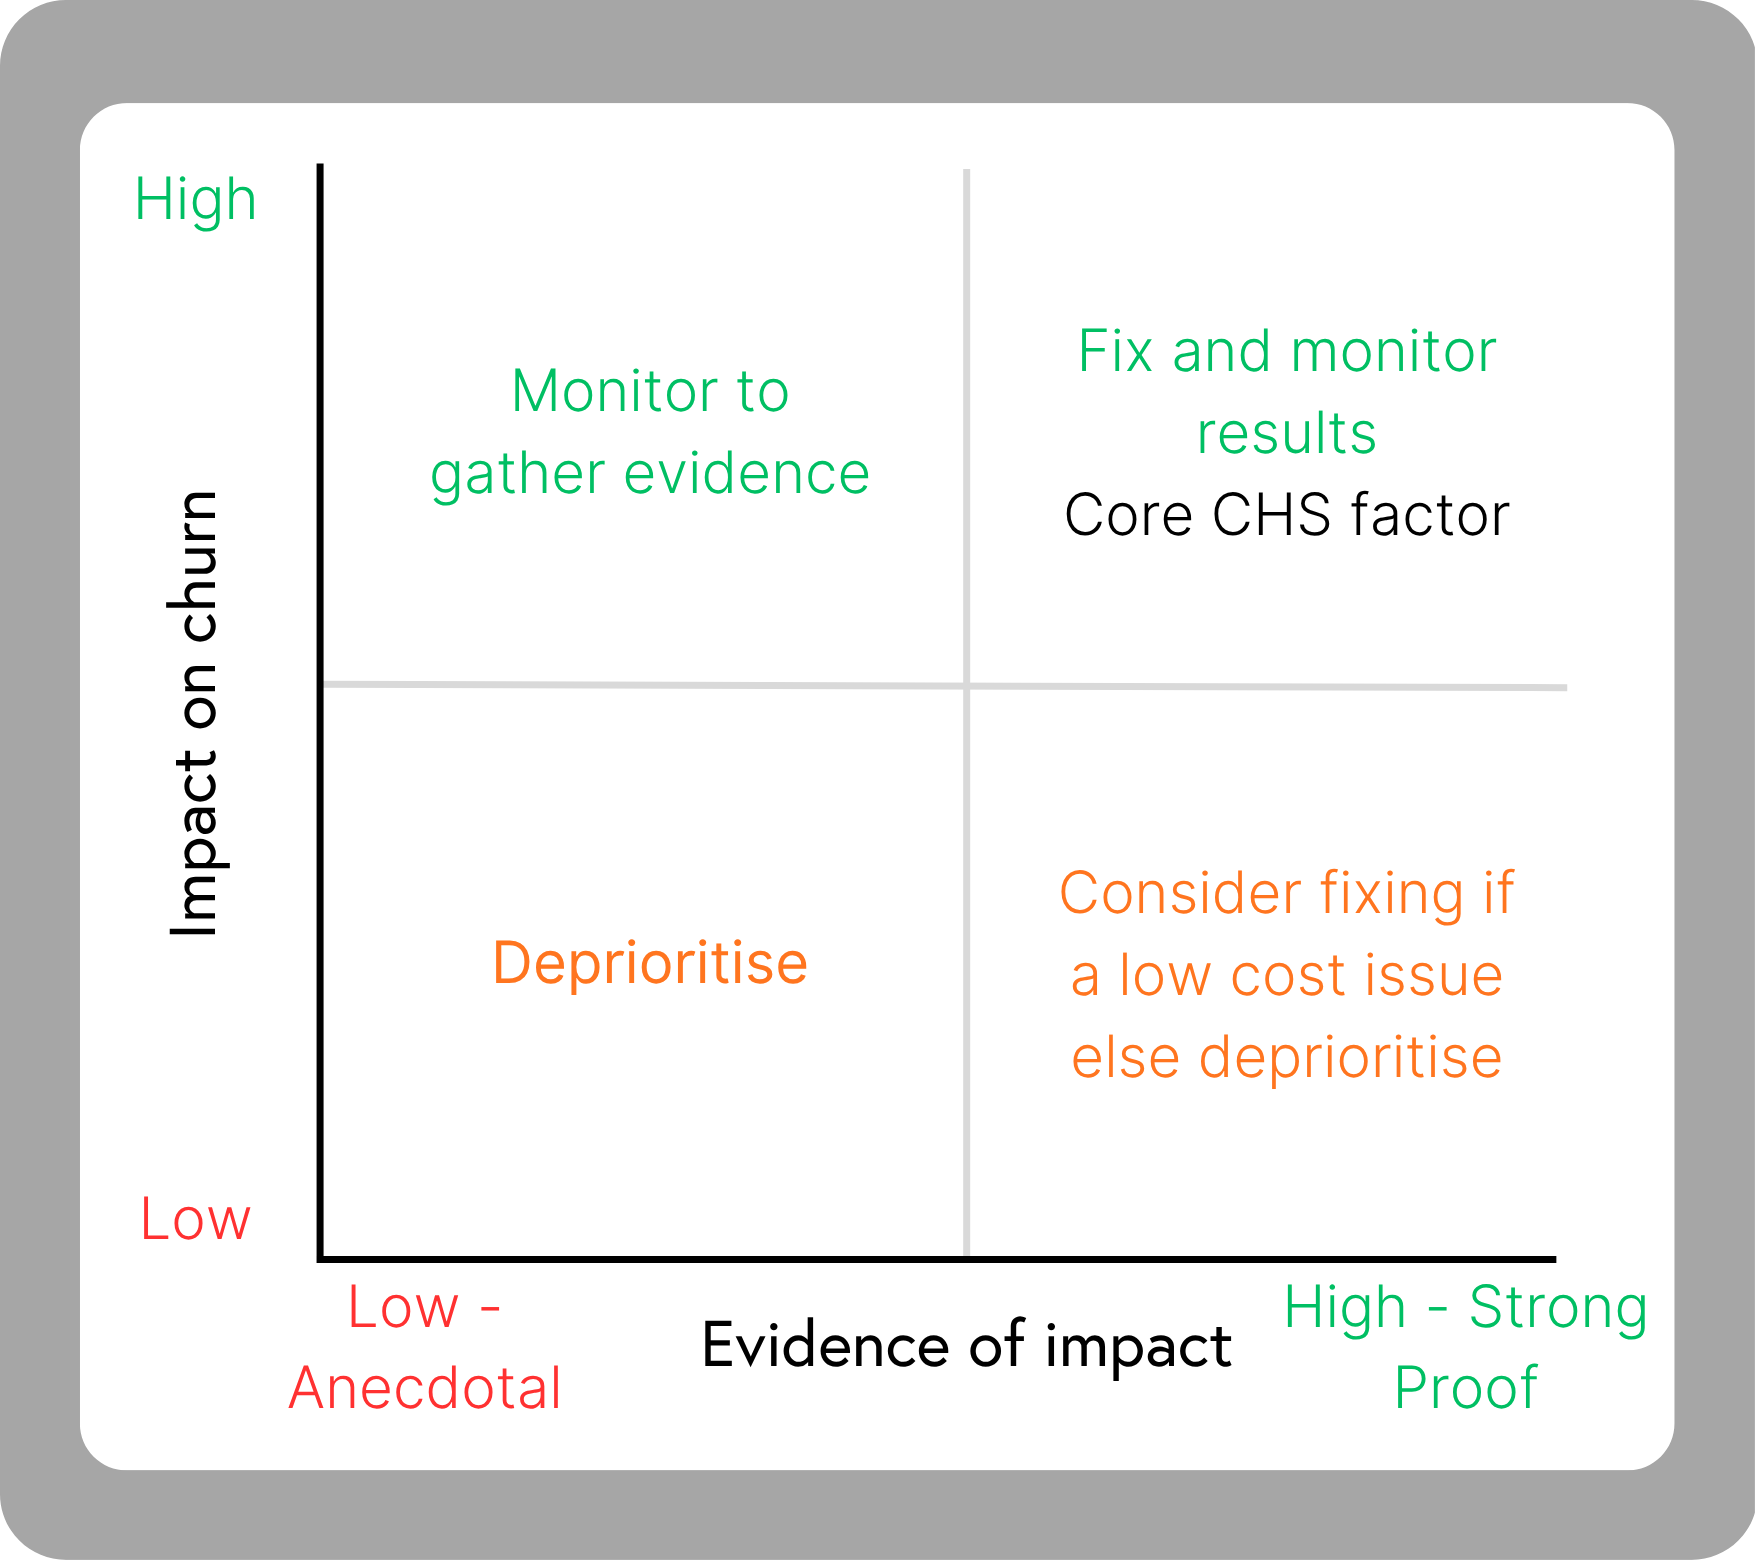
Selecting CHS factors
The grid below will help you select factors. If you are not sure where to start, consider these types of metrics (high value must always be healthy):
Outcomes achieved - Where customers have reached the result they bought the product for. If you can't see this in the product, you may need to ask them, e.g. 70/120 accounts.
Non-contracting accounts - Where accounts didn’t shrink (held or grew), e.g. 90/120 accounts.
Stickiness - Accounts using the product as regularly as expected, e.g. 80/120 accounts.
Value demand - Support contact when it was not about a problem (i.e. not failure demand). E.g. 10200/20030.
Examples of this would be:
Stickiness - 80% of seat licenses are used at least weekly.
Or you may have an unrelated category:
Active champion - The main champion who bought the product is still there.
Within the grid, you then have the following fields:
Value gives you a percentage for each factor.
Weighting allows you to set the importance of that factor. With just two factors, a weighting could be 0.65 for non-contracting accounts and 0.35 for stickiness. Weighting must always add up to 1.
Weighted value example with two factors - Value × Weighting. With the two factors above:
Non-contracting: 75 × 0.65 = 48.75
Stickiness: 67 × 0.35 = 23.45.
Customer Health Score (CHS) = 48.75 + 23.45 = 72.2
Trend RAG - Alongside the health of each score, you should consider how it is trending. You need to consider trends, as a healthy value could be misread if it's falling. There are two key scenarios here: a sustained drop over time and an unexpected downward fall (which is often easier to see). You should track trends outside of this canvas to ensure both these scenarios are visible. Beware of reacting to normal fluctuations. For example, the number of active users logging in each month may naturally fluctuate between 80 and 100. If you were to see a drop to 50, this should trigger an action.
It is important to be clear on what the RAG colours mean:
Red - action strongly recommended.
Amber - consider acting.
Green - leave for now, healthy and stable.
Churn to no one
These problems may be the same as those that caused customers to switch to a competitor. The following process shows how this section should work.
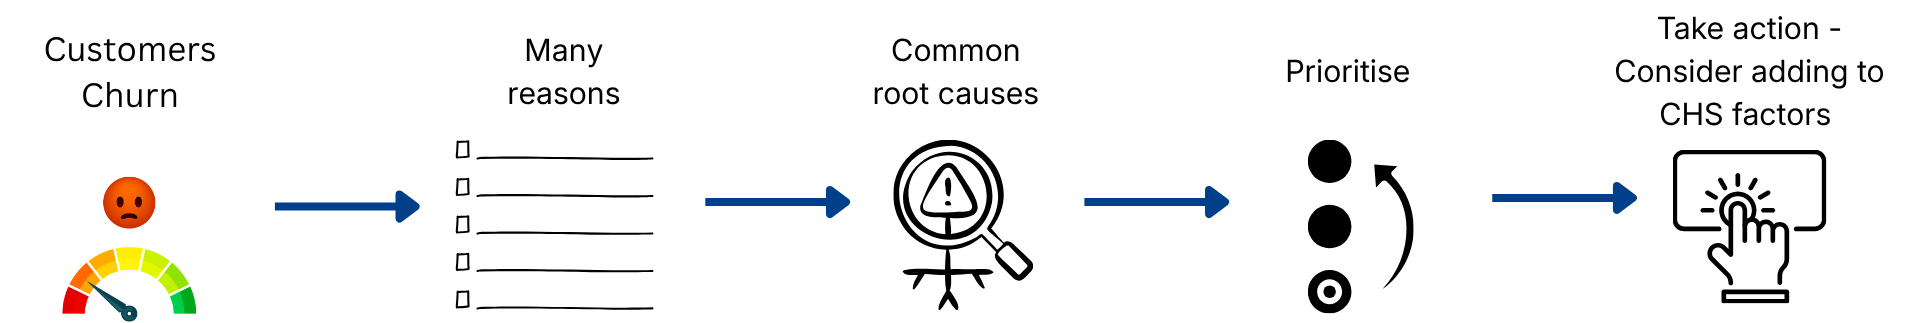
Further process advice:
Many reasons - Churn can be due to a combination of factors at the same time. For example, a poor client relationship and support calls not being dealt with quickly. Only record major issues that are impacting multiple customers. You may need to gather more information here. It can be difficult to get hold of clients after they have left, so having a robust research strategy run regularly, e.g., a quarterly customer satisfaction survey, is important. You can refer back to these for churned customers.
Common root causes - E.g. 10 customers weren’t happy with 8 different things each. At this point, you now have an unmanageable list of items. Some of these issues may be symptoms of the same problem. For example, 6 clients complained that their support issues were being ignored. With more detailed analysis of their support calls, you identify that the root cause was that there was no way for them to provide input into the product roadmap. With root cause analysis in place, you can address this.
Timing - Is there a specific point in the journey where they churn, e.g. onboarding or, if on an annual cycle, before the first renewal?
Prioritise - Do not capture unpreventable churn. For example, where the company is struggling financially or no longer exists. The anti-pattern here will be to record “price”, but the reality is that they can no longer afford to be a customer. There can be other reasons, for example, you are providing a software tool, and they outsource all of their software to a third party and no longer need it.
CHS factors - Not everything can be recorded as a CHS factor. For example, if a common issue is that a key feature is missing from the product, it does not make sense to capture this.
Factors that affect churn
Churn can be due to a number of factors. This list has been provided to help you consider your organisation’s performance. High switching costs may deter an organisation from leaving you even if they are unhappy with the factors below. In this situation, you are sitting on a major risk, if the offering keeps degrading or a competitor reduces switching costs, they may leave you:
Functionality does not meet their needs:
Does not have enough functionality to meet their basic needs.
Has poor usability.
Solves the core problem, but competitors offer additional capabilities they now expect.
Does not meet reliability, performance, and security requirements.
Does not integrate well with their existing stack, e.g. data pipeline, CI/CD.
The account management they receive is poor:
Onboarding support is not readily available and leads to them struggling.
Infrequent or reactive contact where dissatisfaction is regularly building to high levels.
A lack of understanding of their business or use case leads to them not achieving the expected value.
The support they receive is poor:
Slow response or resolution times.
Support lacks the technical competence to resolve issues on the first contact.
Root causes are not quickly tackled, leading to the same problems occurring often.
No easy route for escalation of major issues/complaints handling.
Product development input:
They are not asked about what they want.
They are not listened to when they do provide feedback.
Their requests are acknowledged, but are never shipped (broken promises).
The price does not represent good enough value (cost versus benefit):
Unable to demonstrate or quantify the value you promised. Quantification may include specific measures, such as how much it is saving them/gaining them, enough to justify the price.
Competitors offer better value.
Price has increased beyond inflation/market norms without a corresponding increase in delivered value.
Churn to competitors
Churn to competitors means a customer still has a strong need to solve a problem but isn’t happy with your offering. High switching costs may deter an organisation from leaving you even if they are unhappy with the factors below. Churn can be due to a number of factors. Use the “Factors that impact churn” as a reference guide for these.
Further process advice:
Many reasons - Record only major issues that are impacting multiple customers. You may need to gather more information here. It can be difficult to get hold of clients after they have left, so having a robust research strategy run regularly, e.g., a quarterly customer satisfaction survey, is important. You can refer back to these for churned customers.
Common root causes - E.g. 10 customers weren’t happy with 8 different things each. At this point, you now have an unmanageable list of items. Some of these issues may be symptoms of the same problem. For example, 6 clients complained that their support issues were being ignored. With more detailed analysis of their support calls, you identify that the root cause was that there was no way for them to provide input into the product roadmap. With root cause analysis in place, you can address this.
Timing - Is there a specific point in the journey where they churn, e.g. onboarding or, if on an annual cycle, before the first renewal?
Prioritise - Do not capture unpreventable churn. For example, where the company is struggling financially or no longer exists. The anti-pattern here will be to record “price”, but the reality is that they can no longer afford to be a customer. There can be other reasons, for example, you are providing a software tool, and they outsource all of their software to a third party and no longer need it.
CHS factors - Not everything can be recorded as a CHS factor. For example, if a common issue is that a key feature is missing from the product, it does not make sense to capture this.