



Strategic Direction
Evaluate many inputs into strategy, prioritise and assign to teams
Overview
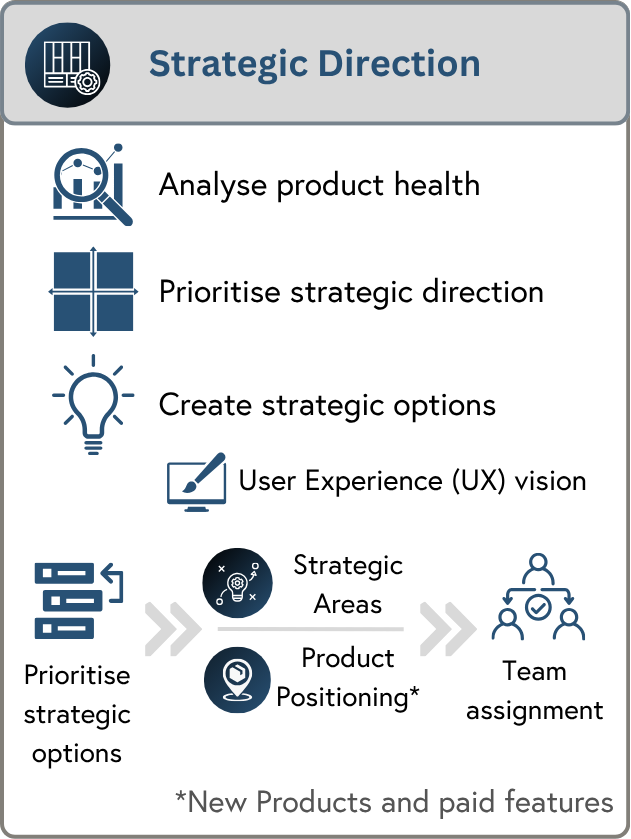
The Strategic Direction stage helps you understand your product health, overall strategic priorities and conduct analysis to identify opportunities for improvement.
Every leadership team believes its product strategy is sound, until churn, spiralling costs, or a competitor's new advantage starts eroding their revenue. The strongest strategies come from broad, structured research that replaces any assumptions with facts.
Before creating strategy options, the process begins by gathering product health inputs that help you set your overall direction. Maybe you need to reduce costs or churn before you look at expanding into new markets. The framework includes several of the world’s most popular strategy techniques to help you make the right decisions.
The Strategic Direction stage results in the creation of Strategic Areas used to deliver incremental improvements to the product. For new products, including paid features, you will create these using the canvas in the Product Positioning stage.
Strategy at scale
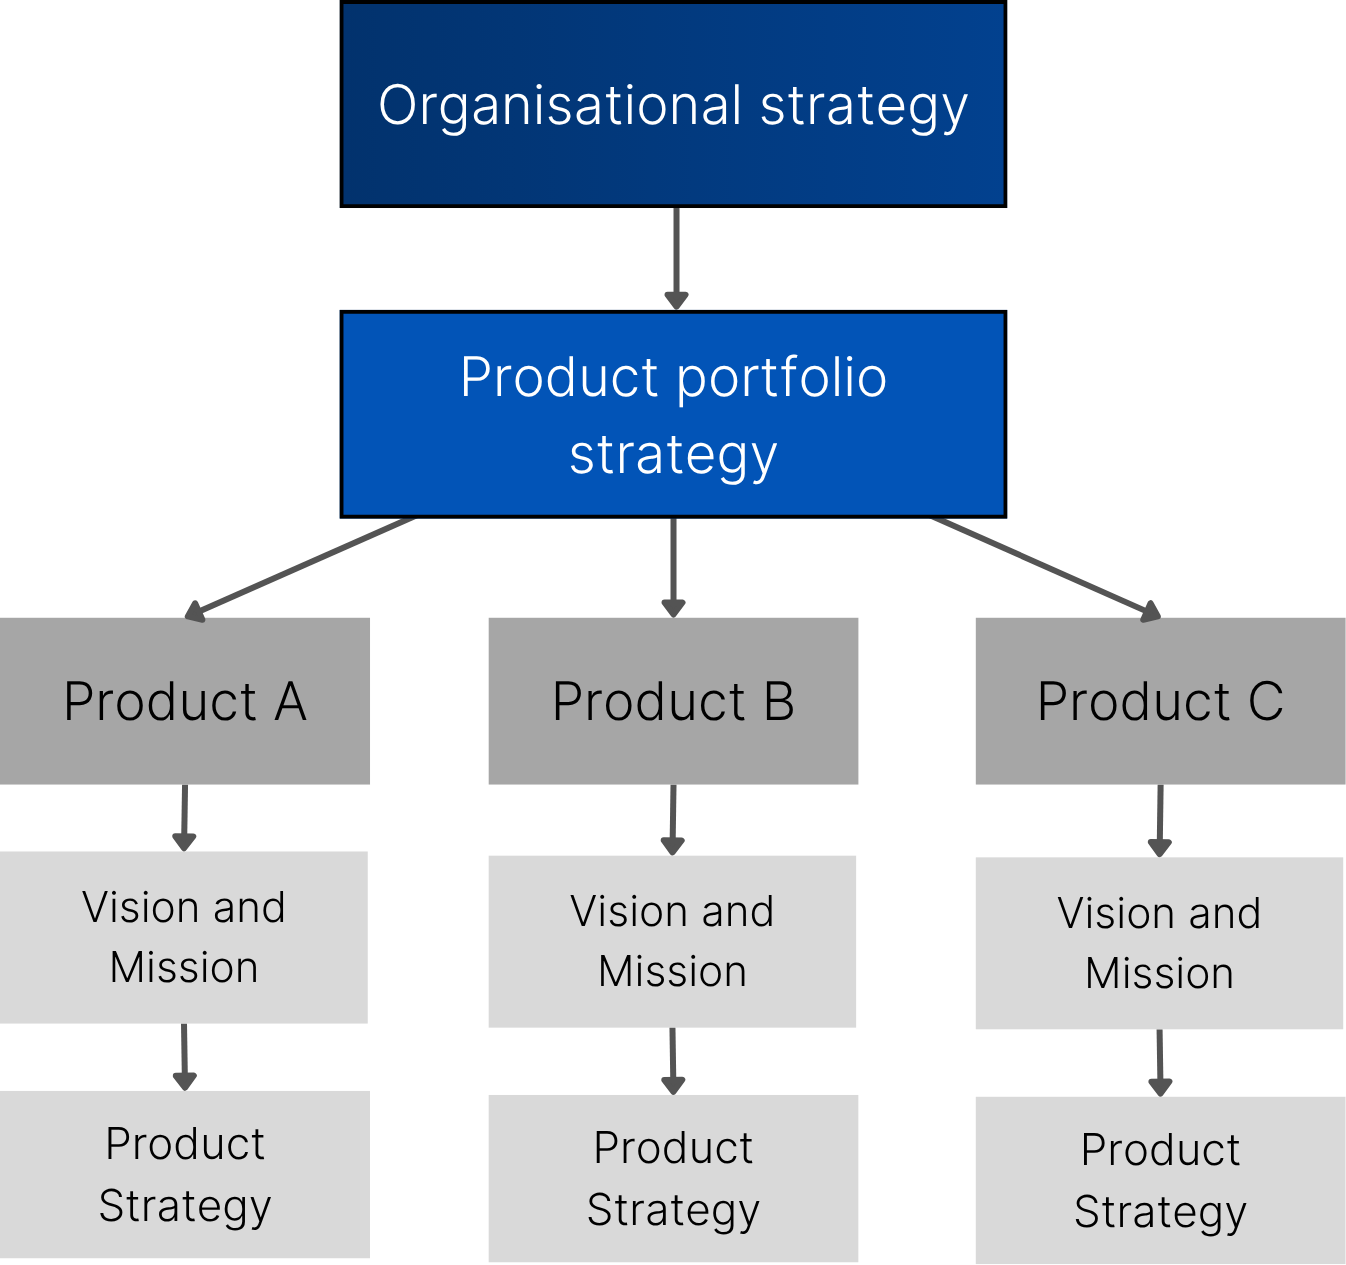
A change to organisational or product portfolio strategies can impact each product’s direction. For example, the product portfolio wishes to move from targeting small businesses to enterprises. Another example would be the organisation seeking to be more cost-efficient across all of its product lines.
You may be using vision and mission statements that anchor your product’s long-term strategy. Consider updating these if a new strategy results in significant changes to your market, customer needs, or technology landscape.
Strategic Threats and Opportunities Canvas
The process tab below the canvas contains instructions on how to populate it.
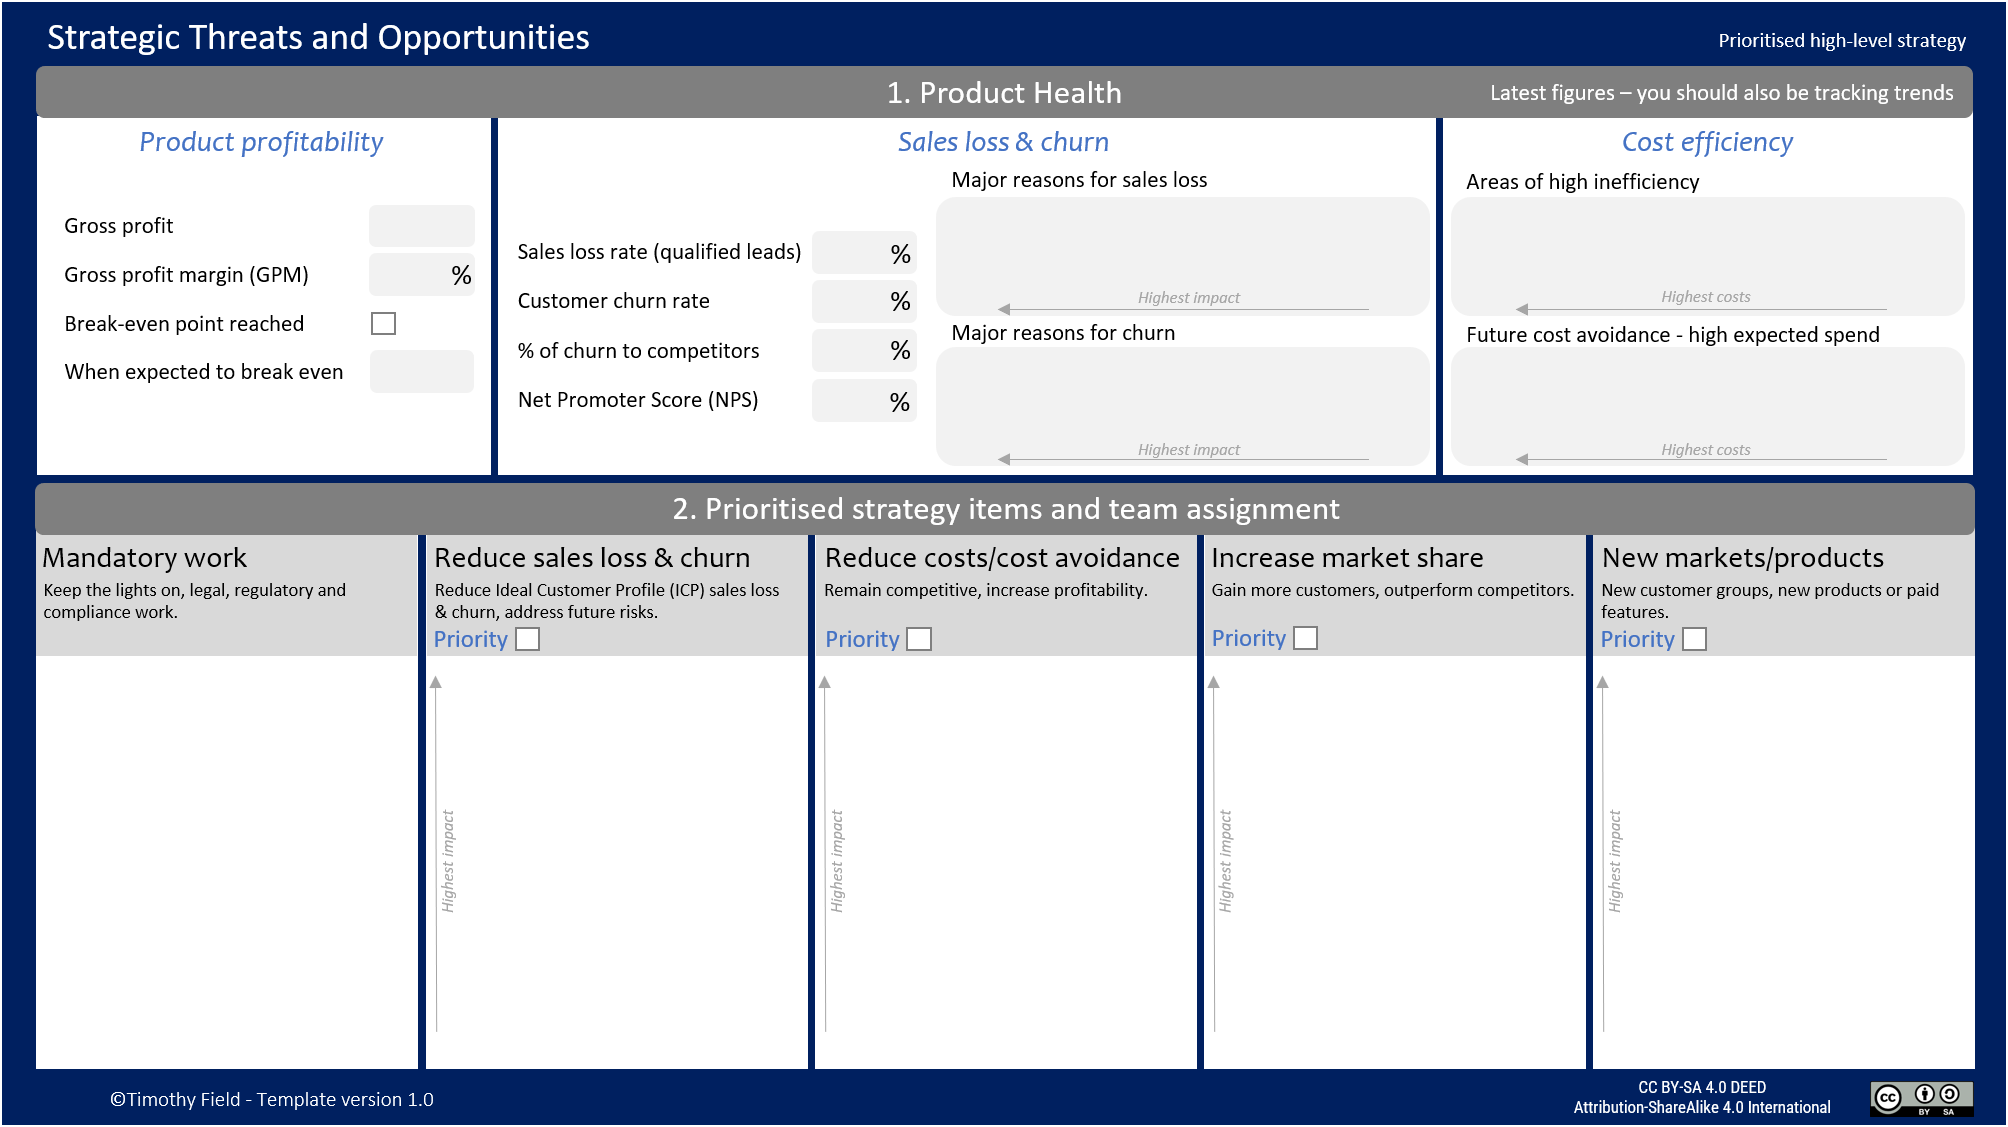
Feel free to recreate the canvas in a tool of your choice. Please attribute the author (Timothy Field), the source of the canvas (this webpage) and add the CreativeCommons BY-SA license
Strategic Items and User Experience Vision
Strategic Items are lightweight inputs into your prioritisation. They help you structure your strategic options. Without these, you may have many unstructured ideas that are hard to evaluate. You will add the ones you have prioritised to the second part of the canvas and assign them to your teams.
The UX vision is designed to bring these to life. This helps you visualise more complex solutions at a high level. It can help with understanding build feasibility, allow for early customer desirability testing and assist with strategic decision-making. Business and technical teams should validate the UX vision to ensure it is fit for purpose. The UX concept output in the Minimum Valuable Increment stage is a more detailed visual output created to guide development. The UX vision can serve as a starting point for the UX concept.
Delivery and results tracking overview
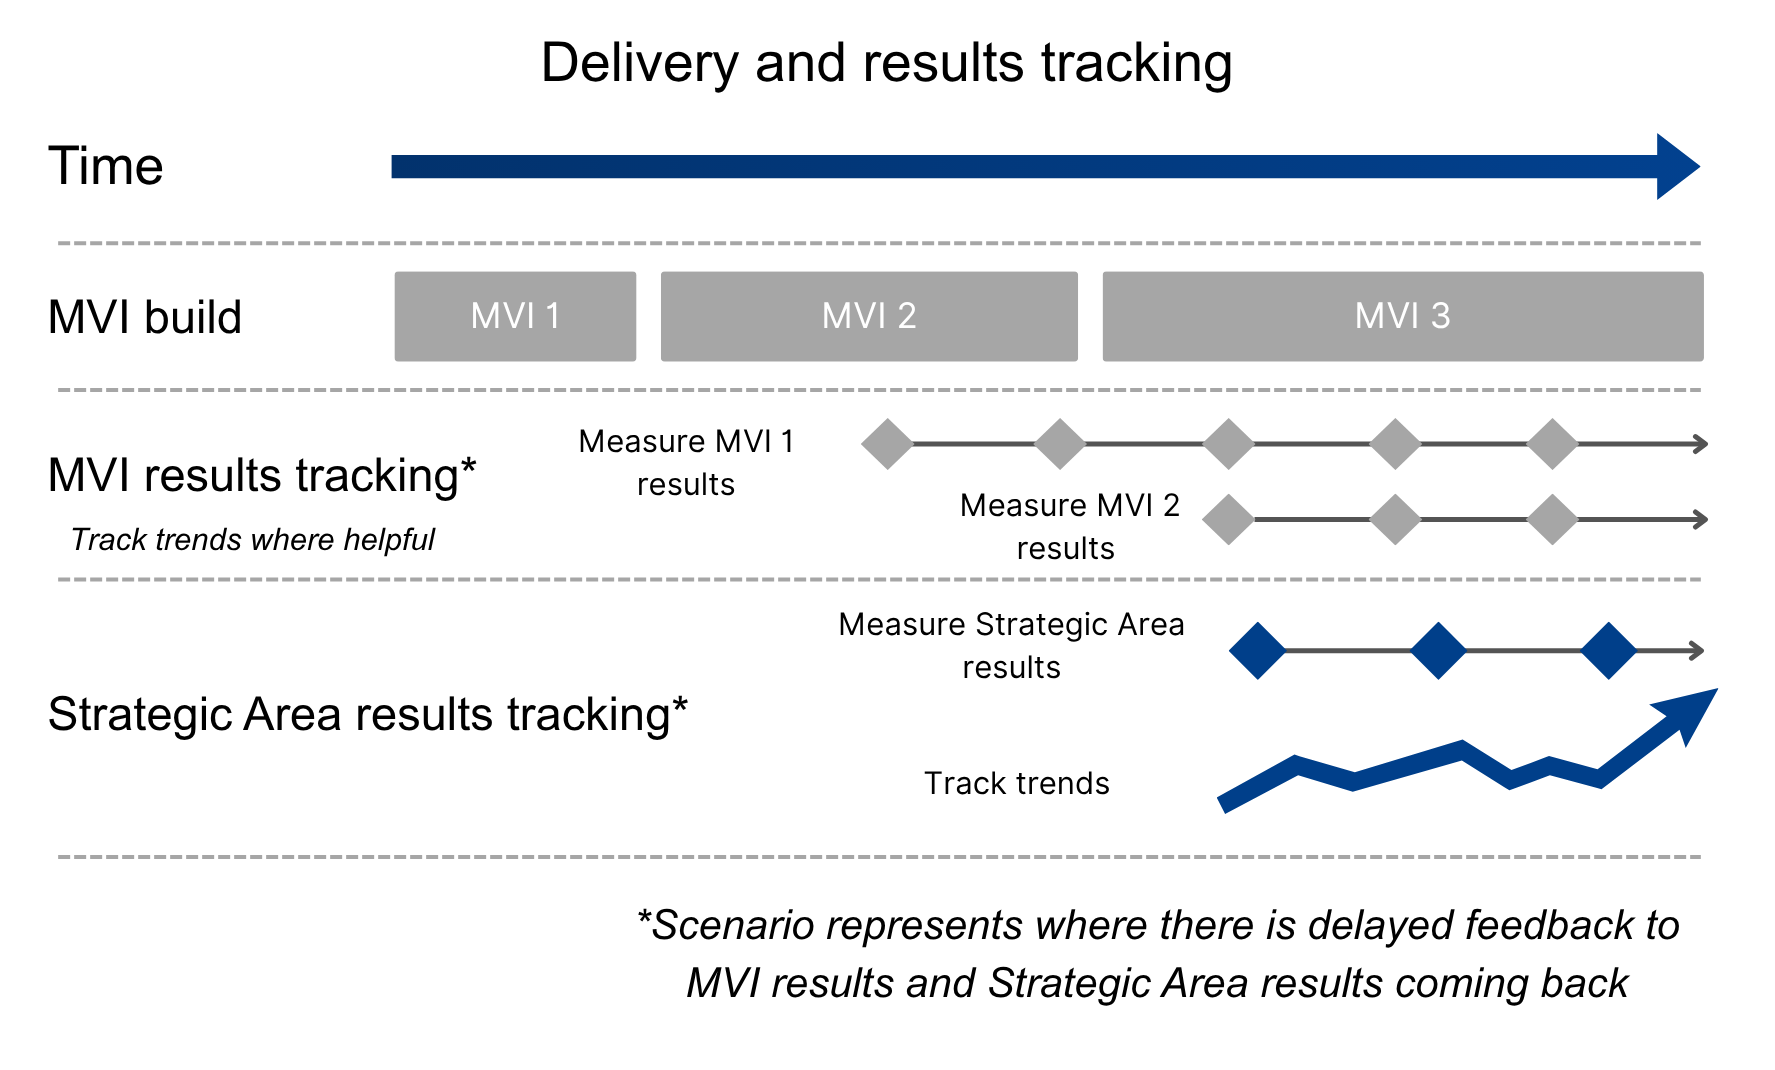
A Strategic Area consists of several Minimum Valuable Increments (MVI). As each MVI is delivered, you will see results coming back from them. These can provide early indicators as to whether the overall strategy is working. For example, you have a strategy to improve low customer satisfaction due to many hard-to-use processes. Each MVI improves a different process. You get results back very quickly that the first improvement is helping. When enough MVIs are delivered, you may see overall customer satisfaction going up. It is very beneficial to set up automated data gathering. If data is hard to get, it can make results tracking difficult and cause people to give up. The picture below represents how MVIs are delivered and results are tracked:
Strategy cadence
Below is a starting point for governance meetings and their cadence. There are two key factors to consider when setting frequency:
How quickly the organisation’s environment is changing.
The time it takes to create value.
These are strategy and outcome-focused meetings. Depending on your organisation’s needs, you may also create delivery progress meetings. Although there is a formal cadence, you do not have to wait for these meetings if results come back that you are not expecting.
| Meeting | Typical Frequency | Purpose |
|---|---|---|
| Product progress | Fortnightly | A lightweight meeting that focuses on Minimum Viable Increment (MVI) results, insights, blockers, risks, and issues. Strategy can be discussed if results are not as expected. |
| Strategy impact review | Quarterly | Objectives and Key Results (OKR) review that includes key learnings and recommendations. Includes a wider group of stakeholders. |
| Strategy meeting | Bi-annual | Full review of strategic direction. |

PESTEL Trend Analysis
PESTEL trends can help you identify strategy options. PESTEL stands for Political, Economic, Social, Technological, Environmental and Legal. You may find multiple solution options from each trend. For example, a technology trend that could be used for cost reduction and new features. Trends are important, some can significantly impact or destroy your market position. For example, a new technology that could replace your current solution. These trends can be applied to all the other artefacts. For example, an AI technology trend may improve the Customer Journey Map. To perform PESTEL analysis, see this page.
Customer Journey Map
The Customer Journey Map is a visual artefact that helps you model the experience a customer has with your product. This is designed with a strong focus on empathy, including how a customer thinks and feels. It can help you take a holistic view of their experience, target pain points and drive improvement. This is especially important where you have different teams responsible for different parts of the journey. This can create a disjointed experience. To create a Customer Journey Map, see this page.
Utility, Usability and Accessibility
These aspects can have a significant impact on the customer’s experience:
Utility - This represents the value to the customer, in other words, how well it solves a customer’s problem and meets their needs.
Usability - Is about how easily a user can achieve their goals.
Accessibility - Accessibility is about designing products and services to meet the needs of people with disabilities. The advice provided is lightweight due to its complexity and importance.
A canvas is provided on this page to help you structure this analysis.
Service Blueprint
The Service Blueprint begins with customer actions and proceeds to map the frontstage (what the customer interacts with, such as websites or service staff) and backstage (internal processes and systems hidden from the customer) components necessary to deliver the service effectively. A Service Blueprint is focused on cost reductionand streamlining services, whereas the Customer Journey Map is more focused on empathising with the customer. Processes can be at different levels of granularity, from a high-level overview to multiple more detailed flows. This can translate to customer benefits, too, by reducing delays. For example, automating a manual security process to make it cheaper and faster. To create a Service Blueprint, see this page.
Business Model Canvas
The Business Model Canvas (BMC) was developed by Alexander Osterwalder and Yves Pigneur to give a bird’s-eye view of how an organisation or product operates and creates value. As well as ensuring your business model is well designed, it can also help you identify strategic opportunities. For example, looking at new ways to distribute to customers to increase market share. The BMC can be used with the Resource Based View (RBV) technique. This can be used for identifying competitive advantages that you may already have but are not utilising. To create a BMC and apply the RBV technique, see this page.
Metrics advice & supporting strategy tools
This section starts with general advice on metrics. This contains some good practice recommendations, such as tracking trends.
Supporting strategy tools. The majority of strategic activities, such as PESTEL analysis, will be done after you have set your strategic direction. For example, if you need to reduce costs, it will not make sense to invest significant effort in looking at market expansion. In this case, you would run PESTEL to identify trends that could reduce costs. The metrics and fields capture the key information needed to prioritise your strategic direction. This activity includes:
This section starts with general advice on metrics. This contains some good practice recommendations, such as tracking trends.
Metrics advice
This guidance is applicable to all metrics.
Capturing trends
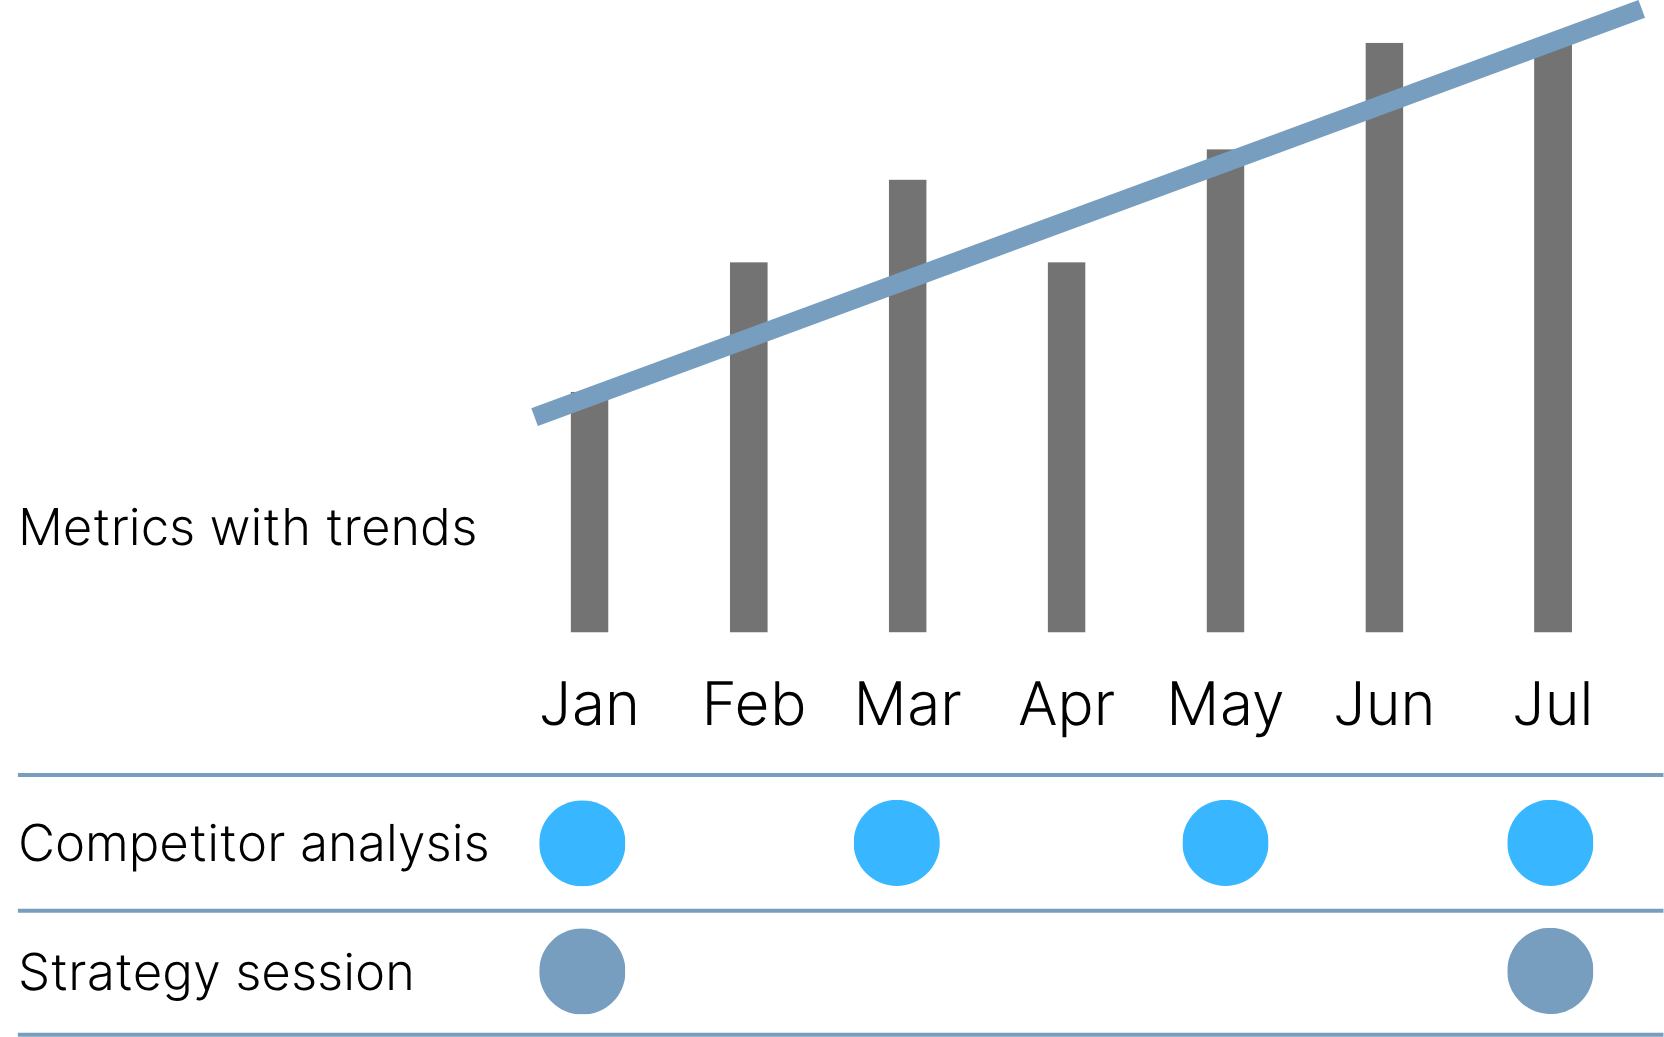
The picture below shows an example cadence for this and the overlap with the strategy sessions. Here we have metrics being tracked monthly and competitor analysis updated every two months. The strategy session is biannual. You can adjust these as you see fit.
Automated gathering
It is strongly advisable to automate the metrics so that producing them does not require a great deal of effort. Consider building a centralised dashboard.
Leading and lagging indicators

“Leading” metrics indicate that something could happen. “Lagging” indicators tell you something has already happened. The benefit of tracking leading metrics is that we can react early. Consider churn, you don’t want to wait until you’ve lost a lot of customers before you act. A good example of leading would be major functional weaknesses. If a competitor has a much better product, you may start seeing sales losses and churn.
Metrics tracking cadence
You can track these metrics more regularly than the cadence of the strategic direction review. For example, if you see major churn you should not sit back and wait, you may need to react quickly. The metrics should be an average over the timeframe.
Additional strategy metrics
These strategy metrics are provided as a starting point. You may wish to track additional ones or even ignore some of those provided.
Supporting strategy tools
This section covers a number of artefacts that can act as inputs into your strategy. Each of these has its own page containing detailed instructions to create them and use them within your strategy.
Sales loss & churn
This canvas section captures sales loss & churn. Churn is focused on subscription-based products. The canvas fields "Major reasons for sales loss” & "Major reasons for churn" can share the same root cause. The instructions are split into two parts:
Product Health - The first part helps you populate the 1. Product Health section of the canvas.
Strategy Item creation - The second part helps you identify potential strategies and capture them as Strategy Items.
Product Health - Sales loss
In the early stages, sales loss can be down to weak messaging. Be careful reacting to these signals. Sales loss starts with qualified leads. Not everything that comes into your funnel is worth counting. For example, you may have a lightweight conversation with someone who is in no way a suitable buyer and never will be. If you count this as a loss, your analysis will be skewed and unhelpful. A qualified lead is typically:
Meets the definition of your Ideal Customer Profile (ICP). To define an ICP, see :
Selling to businesses - B2B Customer Profile Canvas
Selling directly to customers - B2C Target Customer Canvas
You determine them to be a Sales Qualified Lead (SQL):
They have reached a point where they have made some effort to understand your product. Sales feedback on your product/service is most valuable when a customer fully understands your offering and is in a position to judge its value themselves.
In addition to understanding your product, they should also have the budget to purchase it.
Formal SQL definition
Create guidance for the Sales Qualified Lead (SQL) criteria. If you have a sales team, they may need to make a judgement call. Here are some additional qualification methods:
Product-Qualified Lead (PQL) - Where a user or account has reached a key activation milestone that correlates with a paid plan. For example, they have spent significant effort moving data into a trial version of your software.
Trial-Qualified Lead (TQL) - Relevant to products with a limited trial period.
Behaviourally Scored Marketing Qualified Lead (MQL) - A user who reaches a set of criteria. For example, a CEO who has attended a workshop.
Account-Based Signals for B2B - Where a number of users reach a key activation milestone within a business. For example, 3 users are working on the product daily.
Sales loss calculation

Product Health - Customer churn
The Subscription Churn Canvas is provided for in-depth churn analysis. This comprehensive process should be considered where churn or future churn risk is significant. It tackles the systemic causes affecting many customers and the targeted interventions needed for a small number of high-risk, high-value customers.
Churn is a lagging indicator of product health, and you should not wait for it. This canvas will help you track the leading indicators of churn, such as Net Promoter Score (NPS), and covers how to set up customer health tracking. Churn and low NPS can lead customers to leave negative reviews, which can affect future sales by making it harder to attract new customers.
Customer churn rate
Churned customers have experience with your product/service, and you do not have to counter a potentially uninformed view from your sales pipeline. The customer churn rate is the percentage of customers that churned over a defined time period:
To a competitor - Where customers still need a problem to be solved, but select an alternative solution from your competitors. This reflects a strong continued need for a solution.
To no solution - This metric is not captured on the canvas but can be implied by knowing the rate of churn to competitors. It includes customers who cancelled or paused. Sometimes you can’t do anything about the type of churn. For example, a customer may have gone out of business, or their needs have changed. You may see customers churn quickly when your solution does not solve a big enough problem for the price. This is typical of strong marketing and sales promises that are not delivered upon.
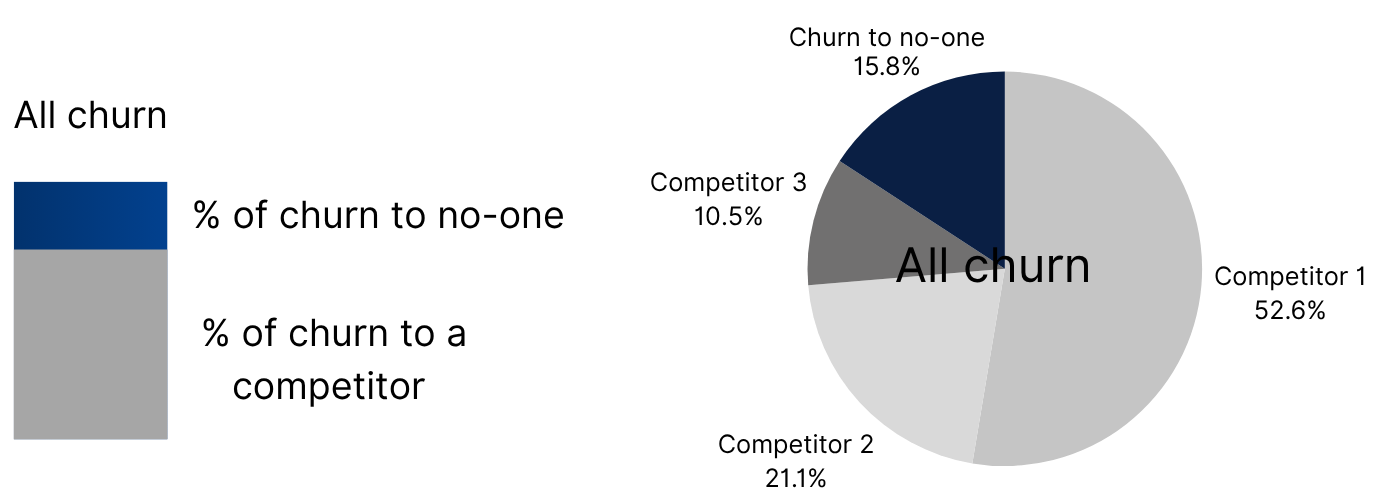
In this example below, you have a significant problem with Competitor 1.
The churn rate represents the percentage of customers who have left over a time period. This can include:
Subscriptions.
Stopping repeat purchases.
Contract or policy cancellations or non-renewals.
Stopping usage.
Mobile app deletion.
The churn rate should be captured monthly and tracked as a trend. Churn will naturally fluctuate, and you should avoid being too reactive. Seek to identify the root cause of unusual spikes.

For example:
((20 customers at the start of the time period - 18 customers at the end of the time period) / 20 customers at the start of the time period) * 100 = 10%
Written in long form:
(20 - 18) = 2
2 / 20 = 0.1
0.1 * 100 = 10%
In tiered pricing used for subscriptions, you may also break down the churn rate by tier. For example, a top pricing tier that earns you a lot of money has a high churn rate, and you need to respond.
% of churn to competitors
This is the percentage of your customer churn who went to a competitor. This is typically due to you lacking the competitor’s functionality/functional depth, your quality is too low or your price is not competitive. With regards to functionality, the metric is a key indicator for gauging your value proposition’s strength.

Net Promoter Score (NPS)
Net Promoter Score (NPS) indicates how likely a customer is to recommend you. This likelihood is scored on a scale of 0 to 10. NPS is included in the Subscription Churn Canvas. It is also included here in case you don’t want to run that full process. A poor NPS score can lead to churn. In addition, you may experience further damage to future sales from unhappy customers sharing their negative experiences.
NPS is a strong high-level signal of churn risk. For example, a customer who is unhappy with your environmental credentials may still use the product regularly and derive value from it while looking for an alternative.
Calculating NPS
Ask the following question to determine your NPS Score:
How likely are you to recommend us to someone?
Scores 0-6 are considered negative and may be at risk of churn.
7-8 are considered neutral.
9-10 are considered positive, with a high likelihood that they will personally recommend you.
The NPS score calculation ignores the neutrals.
NPS is calculated like this:
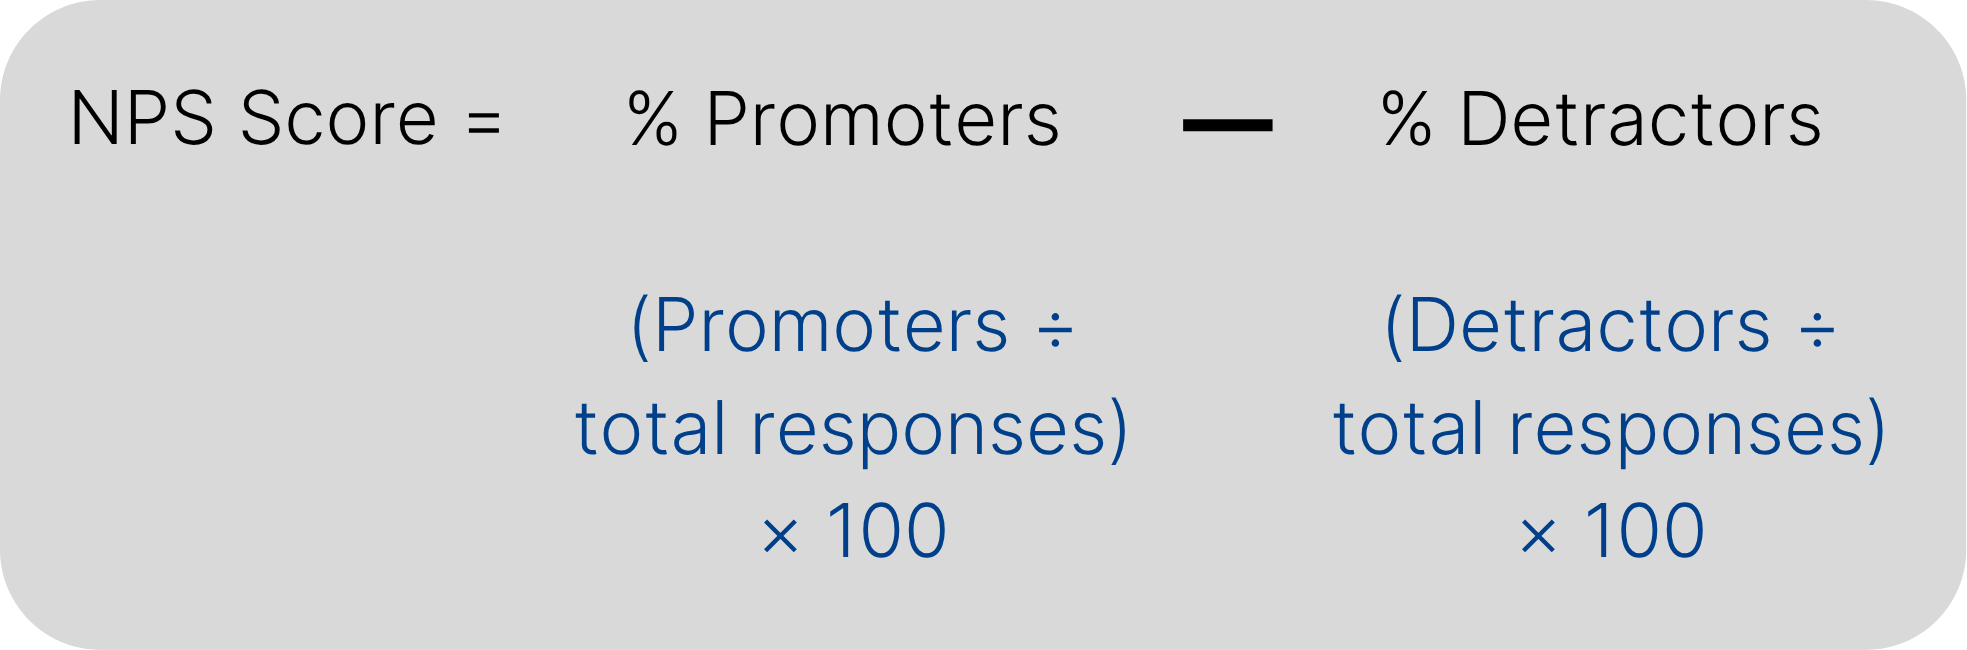
If detractors outnumber promoters, you may end up with a negative score, e.g. -20. Note: this is not a percentage but a score that can vary from -100 to 100.
The traditional approach was to send an NPS feedback request annually. This may be suboptimal as it represents a very slow feedback loop. Consider going faster, such as within quarterly or biannual relationship surveys. Always pair the NPS question with an open question asking why they gave that score.
Product Health - Sales loss & churn reasons
Given the high levels of sales loss and churn, you should investigate the key reasons behind them. Their root causes can be the same. Where you have major sales loss and/or churn to a specific competitor, consider using the Competitor Threat Analyser canvas for more detailed analysis.
Major reasons for sales loss & major reasons for churn
The canvas contains these broad reason categories representing that all manner of factors may impact sales and churn. These should be ordered by impact. Avoid listing low-impact or temporary issues that do not require a strategy. Below are some common issues you may encounter:
Value proposition weaknesses
The Product Positioning stage contains a canvas to help you model your overall value proposition. This considers factors like understanding the key problems you solve for customers and your product/service differentiators. In the sales stage, your value proposition may be poorly understood. The customer does not have a full experience of your product and can be impacted by:
Poor messaging - You may have a strong product offering but are unable to adequately explain this to customers.
Lack of trust - This can be a problem if you are not an established trusted brand in the market. The following are examples of how to build trust: partnering with other trusted companies, releasing thought leadership content, and speaking at conferences.
Service and product quality issues
In some cases, you may have major failure points, such as customers struggling to set up their product, that are directly attributable to sales loss/churn. However, it is not always possible to attribute individual issues to sales loss and churn. A consistently poor service or an error-prone product can compound into major dissatisfaction. In this case, you should identify these recurring themes. These are some sources of useful information:
Recurring service desk tickets.
Internal feedback from support teams.
Direct customer feedback - Information can be gathered through formal surveys or informal discussions.
On social media and review sites.
Internal reviews:
The Utility, Usability and Accessibility canvas is provided to help assess your software. This includes software quality, which can affect aspects such as reliability and security.
A Customer Journey Map can be used to model the journey a customer goes through when interacting with your organisation.
The Service Blueprint builds on the journey map and also models how the organisation works behind the scenes. Internal inefficiencies and failure points can impact the customer.
Other factors
There can be many other factors that impact you, such as pricing, competitors’ high switching costs, and customer relationships.
Strategy Item creation
With the major reasons for sales loss & churn understood, you can now create Strategy Items to tackle them.
Too many issues
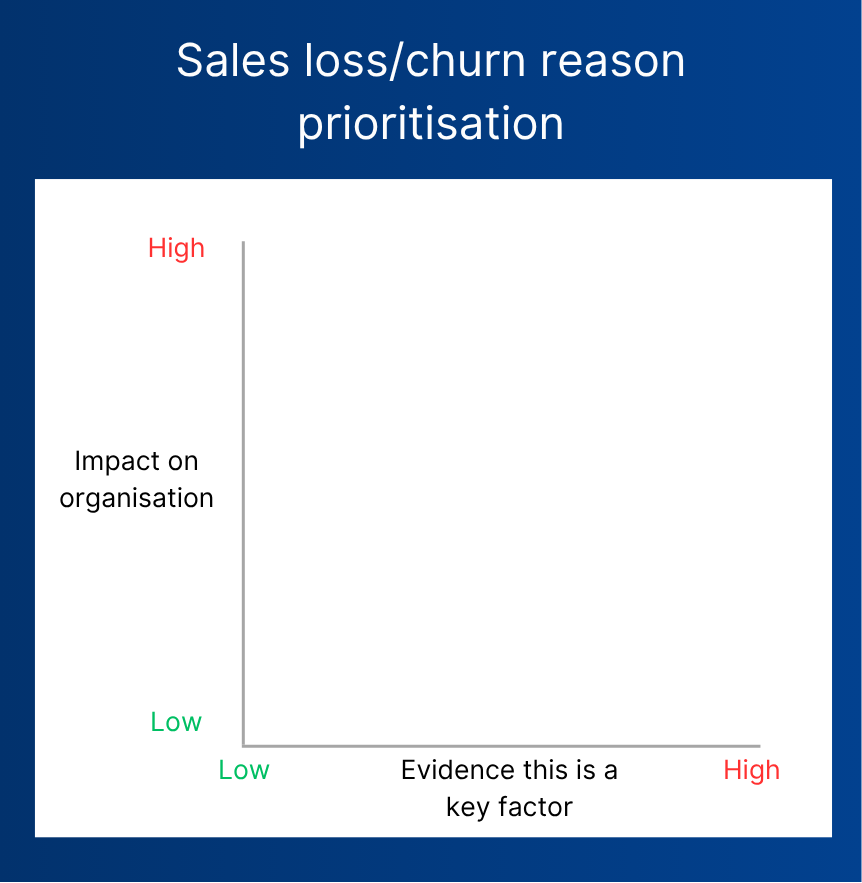
You may not have the capacity to address all the sales loss and churn reasons you have identified. For example, you have 8 distinct root-cause issues, and, despite all being important, you know you only have the capacity to take on two. Use the grid below to help you prioritise.
Churn is usually more important than sales loss. According to this HBR report, the cost of acquiring customers is typically five to twenty-five times higher than that of retaining existing ones.
Increase market share
This is defined as gaining more customers and outperforming competitors. The following can help with this:
Identify unmet needs - Where customers are struggling (pains) or new ideas for creating delight (gains).
Strengthen differentiation - This is particularly important where you have a strategic focus to be differentiated.
Reach new adopters - Win new customers who are new to your type of solution.
Target weak competitors - Attack strengths and highlight weaknesses.
Create barriers to entry - Make it harder for new competition and put your existing competition under pressure.
Improve your business model - For example, using new customer awareness channels.
Remove barriers to expansion - For example, capacity limitations with internal team processes. Assessing this after you have prioritised your strategy is strongly recommended to see if you will have new bottlenecks based on your expected growth.
Identify unmet needs
Where customers are struggling (pains) or would have ideas for improvements (gains).
Pains - The main problems that customers are having. Quantify these to understand the impact.
Gains - Ideas to improve the customer’s experience and create delight. These should still solve a sufficiently large problem. Without this consideration you can end up with customers and stakeholders brainstorming features that are of low value.
The Utility, Usability and Accessibility canvas and Customer Journey Map instructions in the “Strategic discovery tools” tab can help here.
Strengthen differentiation
This is particularly important where you are following a differentiation strategy. With strong differentiation you can win more sales and gain market share.
Increase the value of an existing differentiator:
Use the “value proposition” section of the Market Positioning Canvas to identify the main reasons you win and increase the value of this differentiator.
Create a new differentiator:
Create one that is working well for a different competitor. You can find these by using the competitor threat analysis canvas. This is a medium-risk strategy, as you know it works for some customers.
Create a new differentiator in the market. This is a high-risk strategy as it is unproven. However, it may impact all your competitors. You can lower the risk if the differentiator is low cost. Be aware that if it is easy to copy, it may not last long. The “Strategic direction inputs” tab contains tools with many inputs for this. For example, conducting PESTEL trend analysis can result in many opportunities.
Reach new adopters
Improving your product and brand equity can increase your reach and chance of a sale. The market positioning canvas and brand positioning canvas provide guidance on how to do this.
Target weak competitors
This section uses the competitor threat analysis canvas that you should have created in the “Strategic direction inputs” tab. The Market Positioning Canvas helps you identify relevant competitors.
You may already know which of your competitors is struggling. In this case, skip to the action options section below.
Summary of competitors
The deals considered in the metrics should only include customers that meet your Ideal Customer Profile definition. If you are attempting to sell to a customer who isn’t and include them in your figures:
Your results will look worse, leading you to react when it is not necessary.
You may change your product and impact the clarity of your value proposition.
The summary grid below is populated from the completed competitor canvases. After this, the section below helps you evaluate each competitor and create actions.
| Competitor Name | % of total sales lost to competitor | % of total churn switching to competitor | Future Threat Level (1 – Low 5 - Very high) |
|---|---|---|---|
Using your metrics
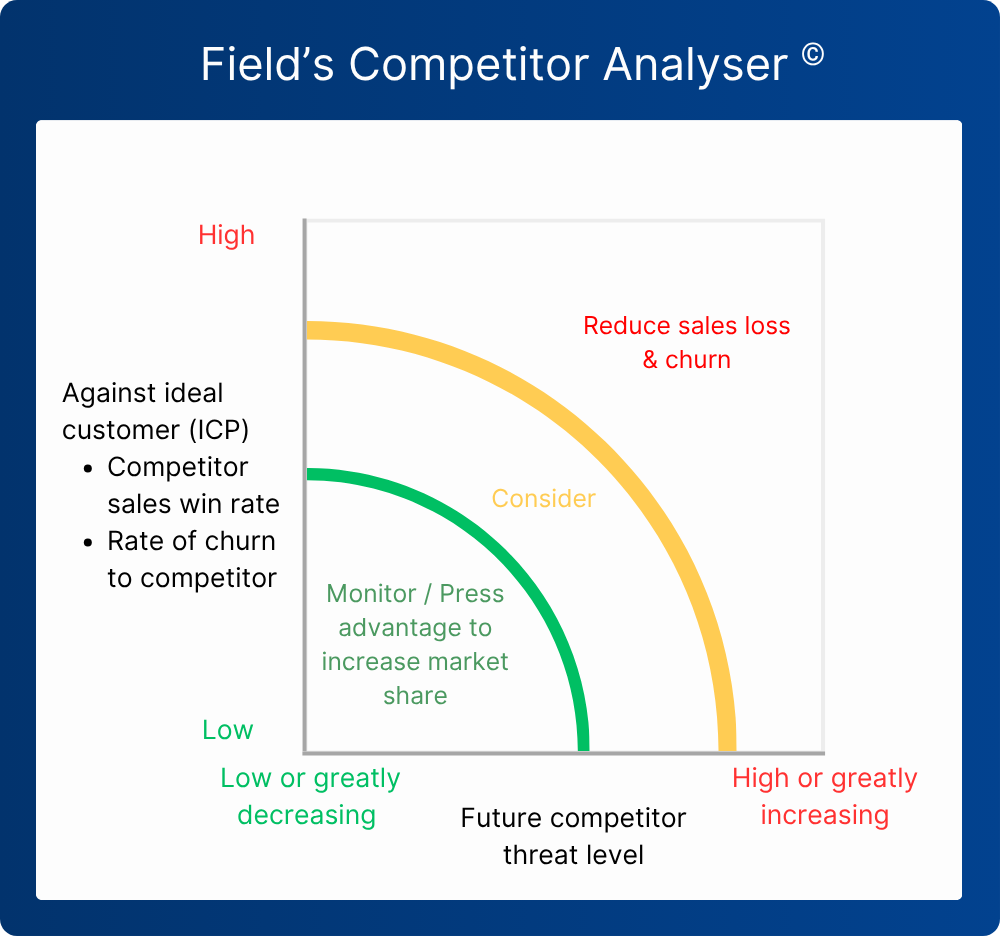
Having gathered metrics, you are now ready to prioritise weak competitors to attack. Consider those towards the bottom left of the grid. Pay particular attention to those you can put out of business. You may be able to take many customers or acquire their organisation cheaply.
Create action options
You are now ready to take action against your prioritised competitors. Be careful of your capacity here. For example, if you are creating ten Strategic Items but only have 3 free teams you may be wasting your time.
Competitor weaknesses
List the key weaknesses of your competitors as identified on the canvas. For each one:
Make sure your product does not also contain these. If it does, then rectify this to provide a competitive advantage.
Consider targeting marketing and sales information around them.
Competitor strengths
List the key strengths of your competitors as identified on the canvas.
Prioritise these based on how much they impact your sales loss and churn.
Differentiators can be part of multiple competitors’ offerings. In the example below, we have prioritised two competitors with Competitor R being the highest priority. This competitor is winning because of 24/7 support, its reports engine and data cleansing feature. Competitor B is also winning because of 24/7 support. We are now ready to evaluate these differentiators to decide what to do about them.
| Differentiator belongs to (strongest competitor first) | ||||
|---|---|---|---|---|
| Differentiator (strongest first) | Competitor R | Competitor B | ||
| 24/7 support | X | X | ||
| Reports engine | X | |||
| Data cleansing feature | X | |||
| Social media linker | X | |||
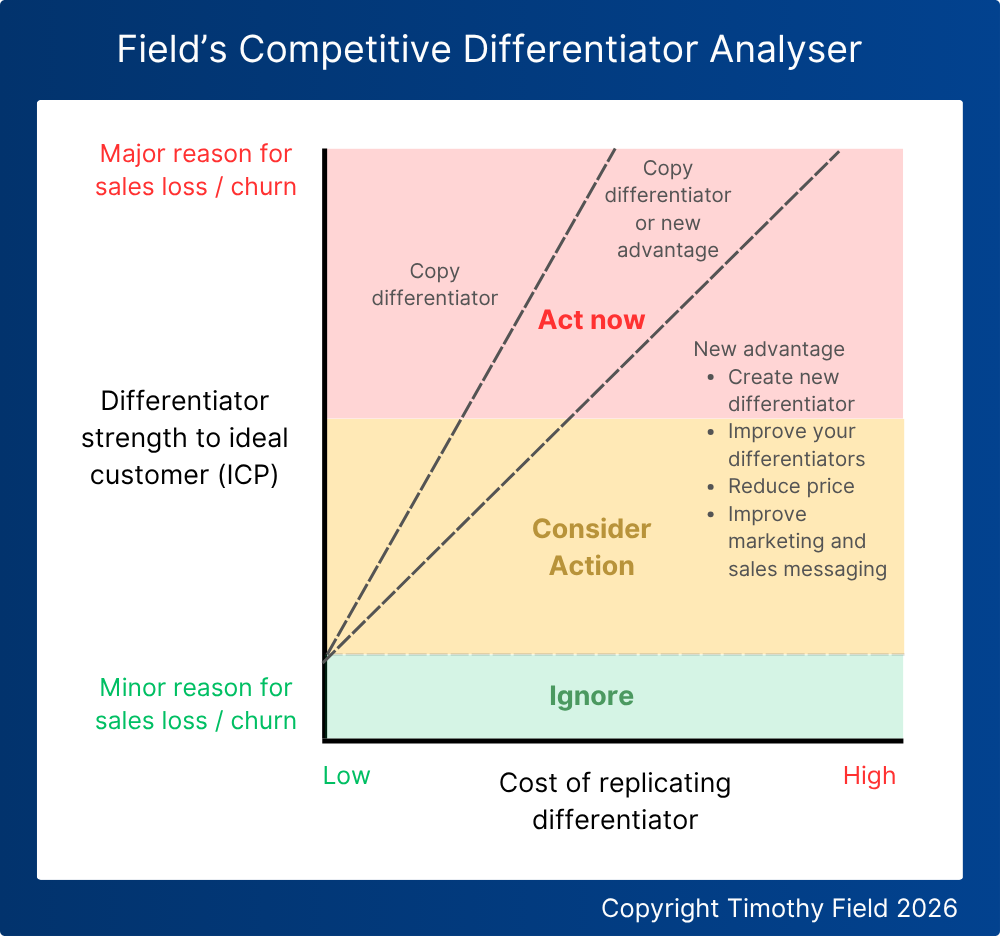
The Fields’ Competitive Differentiator Analyser below helps you decide what to do next. Start with your competitor’s strongest differentiators. STOP when you find you have a few more Strategy Items than teams to deliver them. There is no point in creating many options that won’t go forward.
Options
The graph provides these options:
Act now (red section) - When a differentiator is a significant reason for you losing sales.
Consider action (amber section) - When a differentiator contributes to you losing sales.
Ignore (green section) - When a differentiator barely contributes to you losing sales.
How to act
Copy differentiators - Where the cost of replicating is low, look to replicate the differentiator. This is a low-risk strategy, as you know it works for your competitor.
New advantage:
Create a new differentiator:
Create one that is working well for a different competitor. You should go back to your competitor canvases for these. This is a medium-risk strategy, as you know it works for some customers.
Create a new differentiator in the market. This is a high-risk strategy as it is unproven. However, it may impact all your competitors. You can lower the risk if the differentiator is low cost. Be aware that if it is easy to copy, it may not last long. The tabs contain tools with many inputs for this. For example, conducting PESTEL trend analysis can result in many opportunities.
Improve your differentiators - Use the “value proposition” section of the Market Positioning Canvas to identify the main reasons you win and increase the value of this differentiator. This is a medium-risk strategy as the competitor’s differentiator may still override this.
Reduce price - This is a high-risk strategy. It will make you better value, but it will affect your profitability. Competitors may respond, lowering the overall market profitability, and you may lose all benefits.
Improve usage allowance (subscription pricing model) - This is a medium-risk strategy. It will make you better value, but it will affect your profitability. The competitor may respond, lowering the overall market profitability, and you may lose all benefits. This is a good option if your usage allowance is not competitive or so low that the customer is not able to use the product.
Improve marketing and sales messaging - This is a low-risk strategy. If you believe the competitor doesn’t have a big advantage or you aren’t pushing your own hard enough, focus on these.
You are now ready to create Strategy Items for inputting into prioritisation. Below is an example of copying a differentiator:

Create barriers to entry
Barriers to entry are attributes that make it hard for new competitors to create a profitable product. There are two types of barriers to entry:
Strategic barriers
High switching costs - Increase the cost to switch from your solution so that it puts customers off.
Contracts - Long contracts can make it hard for competitors to gain new customers.
Limit pricing - Deliberately setting a low price so that competitors cannot make a profit. This is combined with your lower costs so that you don’t incur a loss. Exercise caution, you may need to run this for a long time to drive a competitor out of the market.
Predatory pricing - This is similar to limit pricing, but in this case, you lower prices below your own costs and make a loss. This makes it even more difficult for competitors. This is not a strategy you should follow as it violates antitrust laws.
Increase brand strength - Strong brand loyalty can be a significant barrier to entry as customers will even pay more for one they trust. A brand positioning canvas is available to help you with this.
Advertising costs can be much higher to increase brand awareness than for an established competitor.
Loyalty schemes - Offering discounts for staying with a product.
Patents and licenses - If you own these, competitors may not be able to create a product that works or have to sink a lot of investment into new solutions.
Structural barriers
Economies of scale - Where you can leverage significantly lower cost per unit due to a large-scale operation. This can be due to lower operational costs, technology efficiency, and logistics.
Increase network size - You may already have a strong customer network. This will make it difficult to convince them to switch.
High set-up costs - When the initial investment is very high, the new entrant must have enough money to fund this. An example of this would be research and development.
Core product size - Gradually increasing the core product. When all major competitors offer the same set of core features, a new competitor would be strongly advisable to match these. As customers become more familiar with mature solutions, their expectations will grow. Imagine a car without adjustable seats.
Ownership of raw materials - When you have ownership of raw materials, you can either block them from purchasing or raise prices, meaning they cannot compete.
Improve your business model
Use the Business Model Canvas to identify opportunities:
Channels - Optimise and diversify channels to reach more customers.
Customer relationships - Create deeper loyalty and engagement with customers.
Key partnerships - Strategic alliances that can enhance your value proposition.
Revenue streams - Offer new pricing models, subscription services or different ways for customers to pay to expand your reach.
Resource Based View (RBV) - This technique originated from Jay Barney's 1991 article "Firm Resources and Sustained Competitive Advantage". Within your business model, you may have internal aspects that can give you a competitive advantage.
Remove barriers to expansion
You may have specific issues with scaling that are holding you back. For example, a service team that is performing a lot of slow manual tasks. You should identify these capacity constraints and remove the ones that will impact your expected growth. Use previous growth data to determine this. Assessing this after you have prioritised your strategy is strongly recommended to see if you will have new bottlenecks based on your expected growth.
New markets and products
This section covers advice on new markets and products. Both of these strategies can carry significant risk. This section will help you understand and reduce this. You can still create Strategy Items for higher-risk options, but with the advice, you may find better ideas.
New markets
Moving into a new market means targeting a different customer group. The one with the highest revenue potential is called the Ideal Customer Profile (ICP). Below, we see different target customer groups with some overlap between them. For example, we target smaller and medium-sized companies, and the competitor targets medium-sized and larger companies. Those of medium size can fall between both, resulting in a trade-off decision for those customers.

Assessing effort
The amount of work required to compete will differ based on the needs of the new target customer group. This can include product development, new mandatory work (such as regulatory adherence), sales and marketing campaigns. When the difference is large, it is likely that there will be more work. Additionally, you should consider whether the market is large enough versus the effort. A simple visual example of this, with one competitor, is below:

Value proposition clarity
Changing your product to appeal to a very different customer group can confuse your product offering. For example, if you sell to small businesses and then expand to enterprises, you may find a very different set of needs. You now need to support both, resulting in conflicting strategic priorities.
New competitors
Changing your target market can result in new competition. For example, you expand into enterprises and find major competition from large companies. Ensure you have analysed this fully, as you may be unable to compete.
New products
Consider how good your idea is before creating a Strategy Item by considering the following:
Most importantly, does it solve a big enough problem for customers?
Meets basic desirability, feasibility and viability criteria (see this guidance).
Each “Strategic discovery tool” (see the related tab) has advice in it for identifying new product opportunities. The new product generator canvas is provided to help you structure your new product development. This can also be used for new paid features.
Reducing strategic risk
The Ansoff matrix is a useful tool for understanding strategy and how existing organisations can lower their risk of failure. There are four different expansion strategies an organisation can take:

Market development - Reduce risk by finding new customers that are the same or very similar to existing ones. For example, being in a different country. This strategy can be significantly lower risk than new product development, as your product is already proven.
Product development:
Reduce risk by releasing similar products to those you know.
If you are responding to a radically disruptive product, you can utilise your existing customer relationships to gain a competitive advantage.
Diversification - This can be a high-risk strategy. Use the market development and product development risk reduction strategies together.
Risk reduction summary - Use your organisation’s strengths to reduce innovation risk.
Future cost avoidance - canvas field
Cost avoidance deals with expected future costs. For example, you are dealing with a few customers manually, and you know that if you scale, you will need to create a new team. Types of costs to avoid:
Predictable Costs - These are costs you know will happen in the future.
For example, a software license that is going out of date. If not renewed or replaced on time, it could disrupt operations and require expensive last-minute fixes or workarounds.
Technical debt - Includes areas of high technical debt that have already delayed releases, or impacted support or customers.
Scaling Costs
For example, increased hosting or support team costs from an increased number of customers. These should be linked to your expected growth.
Technical debt - Includes needing to update areas of high technical debt, where you know rework is needed to scale the platform.
Risk-based Costs - These are key strategic risks.
For example, you don’t have very good digital security, and a breach would have a reputational impact, financial loss and regulatory impact.
Includes areas of high technical debt that are likely to cause high support costs or impact the customer when changed. This could be an area of poor code quality that is expected to be frequently updated and will regularly break.
As these often can’t always be accurately predicted, the word “estimated” is used in the calculation:

Populate the canvas
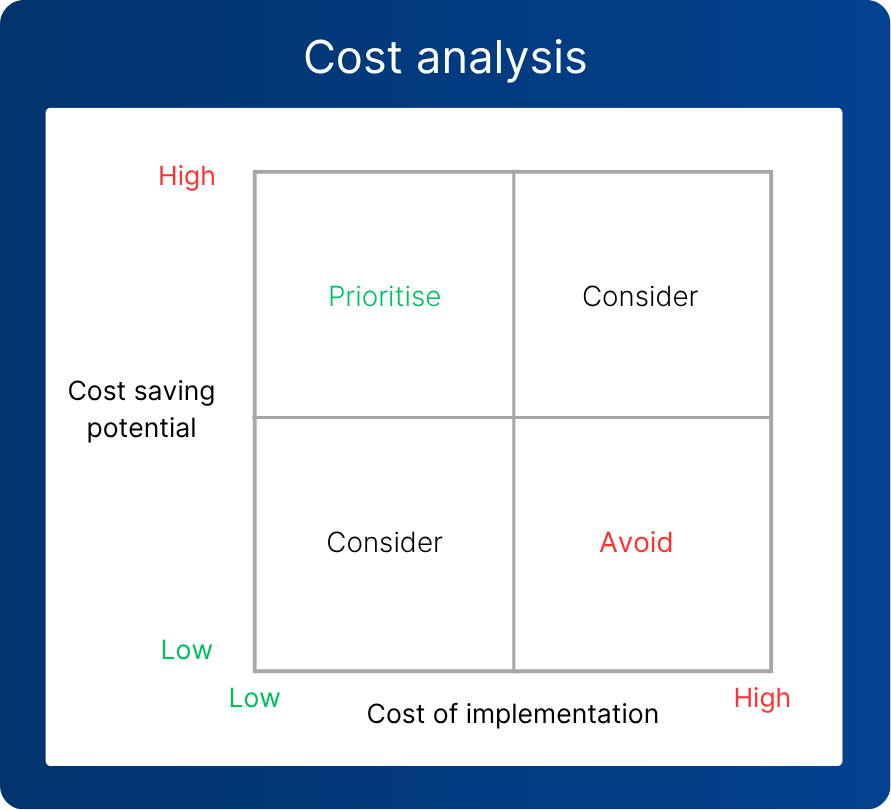
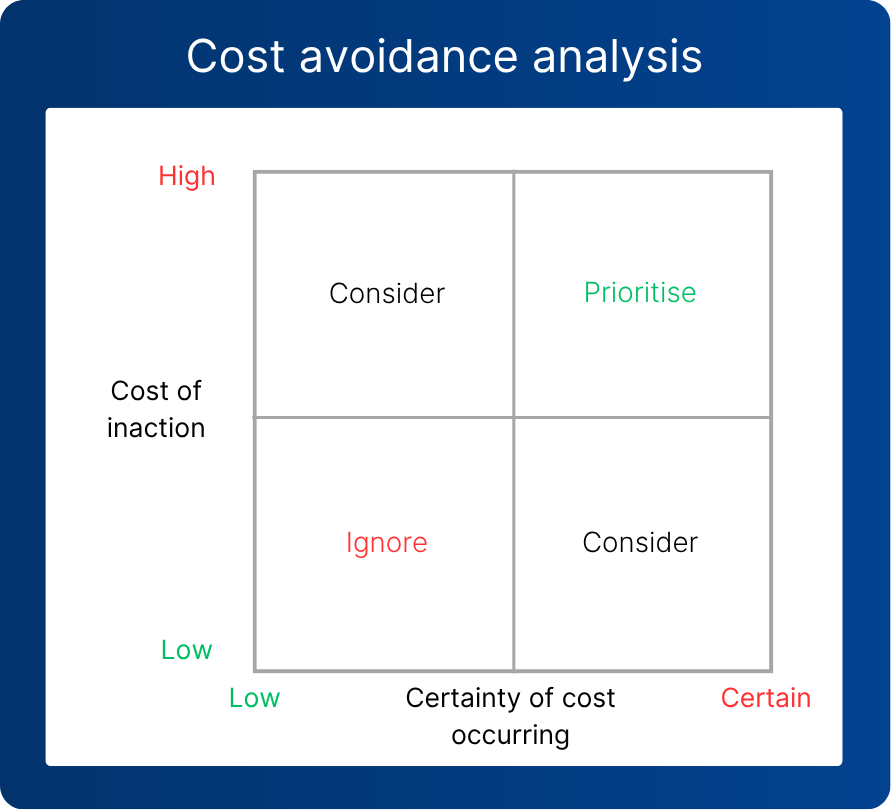
Use the grid to prioritise inefficiencies for the “Future cost avoidance - high expected spend” canvas field.
Strategy Item creation
If you followed the instructions in the section, the solutions to your cost inefficiencies may have already been researched, and you can now create Strategy Items.
For cost avoidance, you may not have looked at any solutions and need to start now. If you discover that the cost of inaction is low, you can decide to remove the item from the main canvas.
Cost efficiency
You are looking for inefficiencies, not just high costs. For example, you may record a data storage cost inefficiency because you know you are storing too much old or redundant data. High costs in themselves are not a problem if they are optimised. You should consider the Return on Investment (ROI) relative to the cost to assess efficiency. For example, you have an expensive AI subscription, but it allows you to write high-quality code much faster than the alternatives. The instructions are split into two parts:
Product Health - The first part helps you populate the 1. Product Health section of the canvas.
Strategy Item creation - The second part helps you identify potential strategies and capture them as Strategy Items.
Impact of cost saving on customers
Be careful not to impact customer satisfaction when reducing costs. For example, you want to save money by using a chatbot for support, but even though it is better for you, you know it will drive down customer satisfaction. Look for solutions that create a win-win.
Vulnerability to lower-priced competitors
Cost efficiency becomes very important if you have a high level of vulnerability to lower-priced competitors. A simple way to evaluate this is to assess at what price profitability would become an issue for you. Below you can see the impact of aggressive pricing where a competitor has a cost advantage:

Canvas fields
The cost efficiency section of the canvas has two fields:
Areas of high inefficiency - These are currently impacting you.
Future cost avoidance (high expected spend) - Avoiding costs that are expected or likely in the future. For example, if you get a few more customers, you may need to hire a support team to handle current manual processes.
Costs you identify may be either:
Fixed - Static costs that don't move with usage. The inefficiency is often under-use, which is paying for more than you consume.
Variable - Costs that change with usage. You may be paying too much for your current level, which will only get worse as you grow.
Areas of high inefficiency - canvas field
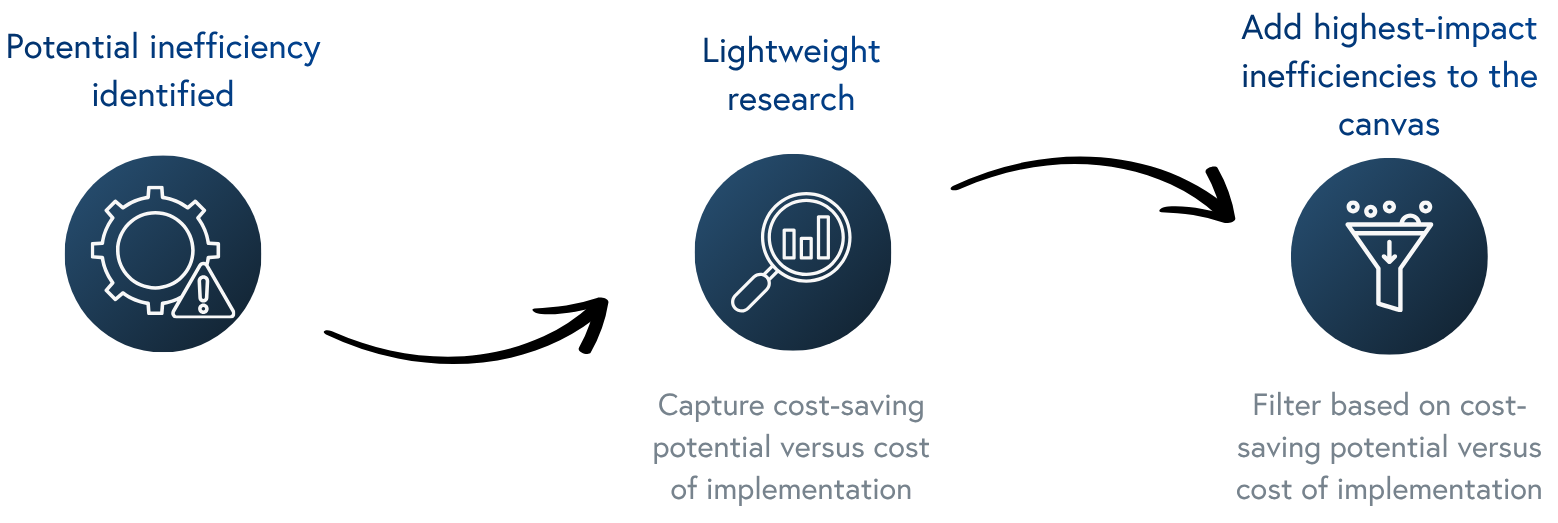
One of the biggest issues with inefficiency identification is that you often need to know the solution(s) before you can identify it. For example, you feel you have high token costs for AI and think there are alternative products that could bring them down. You may or may not be correct, and this requires some analysis. Conducting extensive research at this stage could be wasteful, for example by bringing in vendors to provide detailed quotes, as you may not prioritise this strategy. Do just enough to see if the inefficiency is large enough to be worth capturing. Having real cost-saving numbers, even if ranged, will help with prioritisation. The following picture is a visualisation of this process:
This list has been provided as a useful starting point for inefficiency identification.
Inefficient processes
The following are areas suitable for process optimisation/removal. The two tools below can help you identify issues:
A Customer Journey Map can be used to model the journey a customer goes through when interacting with your organisation.
The Service Blueprint builds on the journey map and also models how the organisation works behind the scenes. Internal inefficiencies and failure points can impact the customer.
These are common process issues:
Failure demand - This is where a customer is contacting you if something has gone wrong. For example, their payment has failed. If you start by optimising a process with high failure demand, you are simply optimising failure. Focus on tackling the root cause of issues first. Failure demand is a concept from John Seddon.
Rework - Work that has to be done more than once. For example, in product build, you may have frequently failed QA or rejected approvals. Rework represents internal process failures rather than customer-focused failure demand.
Manual work - Start where you have simple, repeatable activities. Complex rare edge cases may not be worth automating.
Common customer requests/issues - Look for where customers are relying on you to perform activities they could be doing themselves.
Complex/expensive processes that do not require customisation - These are the processes that do not represent a competitive advantage. For example, you take payments for your product, but there is no discernible advantage to you having your own custom process.
Poor value contracts, licences and subscriptions
You may have represented good value initially, but conditions have changed, meaning these may no longer be good value for money. It is good practice to review these periodically. For example:
You find that you are only using 50% of your product licenses.
The competition’s tooling is now substantially cheaper.
The tool vendor you purchase from is now offering much lower prices to new customers.
The T&M rates a vendor is offering are no longer competitive.
Identifying inefficiency by analysing competitors
Research the factors that allow each competitor to deliver at a lower cost. For example, are they utilising partnerships or specific tooling? Consider copying these. For example, can you utilise the same partnership model?
Populate the canvas
Use the grid to prioritise inefficiencies for the “Areas of high inefficiency” canvas field.
Overall Process
This process will help you prioritise and create your strategy. It consists of the following steps:

STAGE 1 - Inputs
In this stage, you will gather strategic direction inputs. This consists of the metrics and information in the first canvas section 1. Product health. This information will help you make better strategic decisions based on data. You may be capturing additional metrics for your organisation that feed into this decision. Each tab provides full details on how to capture this information. You may assign a lead to each.
Important note: You only need to prioritise a direction and create new strategies when you have excess capacity after identifying mandatory work. For example, you only have one team, and they are tied up with months of mandatory legal work.
Managing research
The formal management of research is highly recommended. Going into a strategy process without suitable preparation can lead to failure. Consider assigning people to lead research activities. For example, you have a customer unit focused on gathering research for churn and sales loss. It is highly advisable to agree a research cadence. For example, you may choose to update your competitor analysis every 3 months.
Mandatory work items
Mandatory work includes anything you must do to keep the business functioning. It includes aspects like:
Legal and regulatory requirements.
Updating software versions to remain secure or removing old software that is going out of support.
Tackling strategic risks. For example, not having good enough security in your software.
If you have enough mandatory work to immediately fill your team’s capacity, assign each team a Strategic Area and stop this activity.
STAGE 2 - Direction
You are now ready to evaluate and select your overall strategic direction. This helps you focus on the most important strategic choices for your organisation and narrow your research. For example, if you have significant cost inefficiencies, it may not make sense to expend effort on researching how to enter new markets at this stage.
The goal of setting a strategic direction is not to stop you from innovating, but to recognise that you may face major threats to your product and need to respond to them.
Strategic Direction prioritisation
This is best done as a discussion with senior stakeholders who have a broad view of the product. This would include people responsible for the product and its service. It can also include marketing, who will understand how customers are responding to your current offering. Do not discuss solutions during prioritisation.
Use the full instructions or the single-page PDF guide below:
Strategic direction meeting
Review the data in 1. Product health - This is the first section in the Strategic Threats and Opportunities canvas. You may present additional information. For example, when discussing major service quality issues, a service manager may bring additional customer feedback.
Optional - Some team members may wish to present additional information. For example, a User Research team could present significant UX (user experience) issues that represent a major future risk to churn.
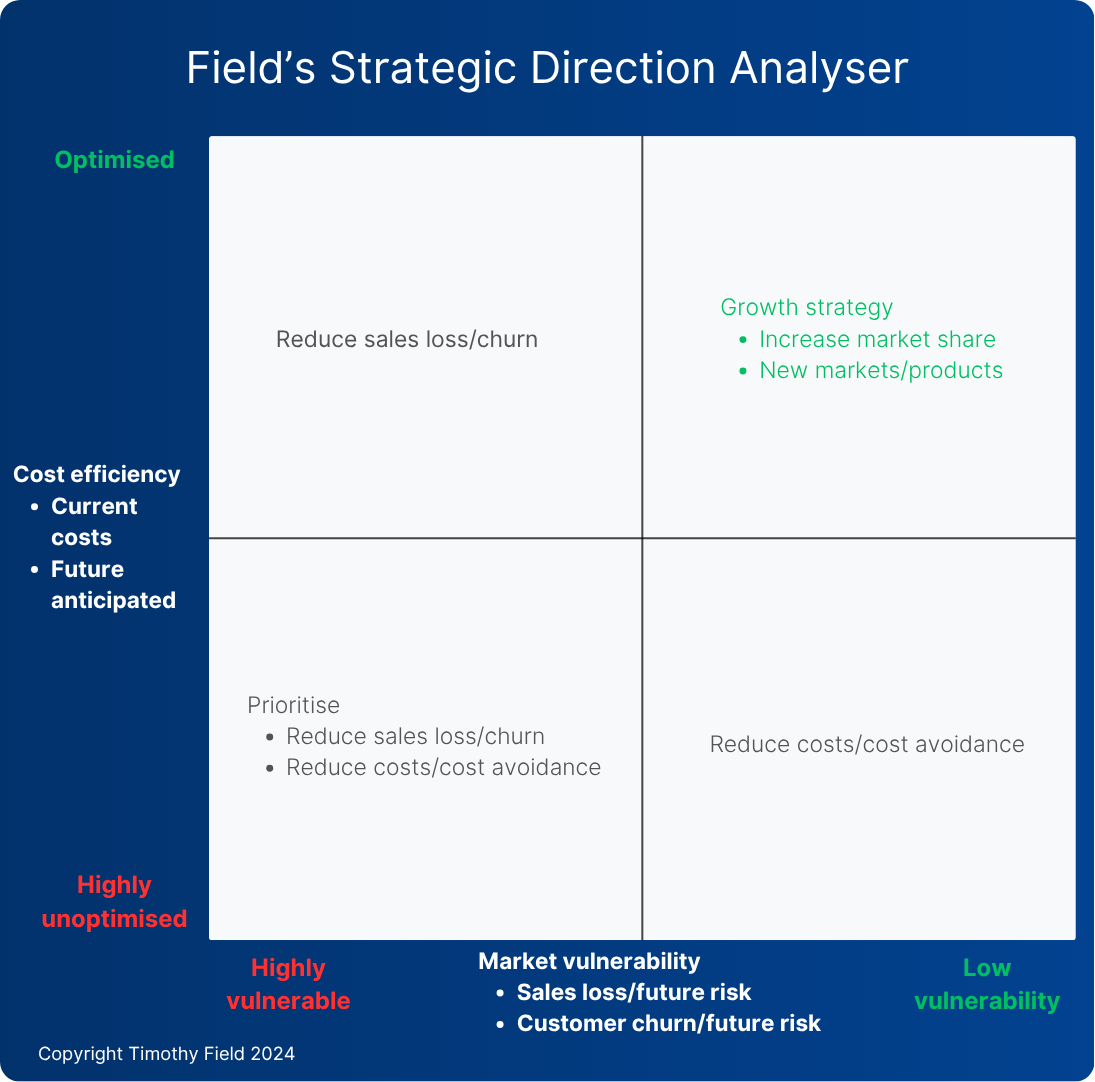
Map your current situation using the Field’s Strategic Direction Analyser (Copyright Timothy Field 2024) - This maps to four strategy areas on the strategy canvas. It does not include mandatory work, as this work must be done regardless. The grid will help you set a high-level direction that can reduce research and focus your solutions. Porter’s Five Forces model is integrated into the analyser to help you consider your competitive environment.
As a team, start by mapping where you are to a quadrant. Each person will have a different view of the current situation, and it is best to get each person to do this mapping on their own, then discuss. The data from the canvas section 1. Product Health should support this mapping. For example, you may have a few highly unoptimised costs that are causing you very low profitability. In another case, you may have major churn.
Use the guidance text to confirm you have selected the right strategy. The sales loss/churn and reduce costs/cost avoidance strategies also include guidance on when to retire a product. This may be a difficult decision, but it reflects that not all products succeed, and this is an important consideration.
Prioritise your strategic direction(s) - There are checkboxes on the main canvas that allow you to select more than one. With a large development team, it may be possible to run multiple strategies. This does not stop you from researching other strategies, but if you are capacity-constrained, it may be wise. Your capacity may be impacted by current work. For example, two teams are working on mandatory legal work and will not be available.
When to select “Reduce sales loss/churn”
This strategy prioritises reducing customer churn and sales loss, including future risks to these. Sales loss and churn can be down to the same factors. For example, a poor quality service or a competitor’s strong differentiation. The following metrics and considerations may lead you to prioritise this defensive strategy:
Metrics:
Sales loss rate (qualified leads) - You may be losing to competitors, or they are not purchasing anything. Qualified can be defined as:
They meet your Ideal Customer Profile (ICP) definition. These customers will have a need that matches your offering. Customers who don’t meet the ICP definition will be less likely to buy and can skew your figures. To define an ICP, see:
Selling to businesses - B2B Customer profile canvas
Selling directly to customers - B2C Customer persona canvas
Have gone far enough in the sales journey to demonstrate a clear intent to buy. For example, a product trial or a training course. This is not the initial 1-hour sales pitch, as that is low effort/commitment. They may have reached out themselves following their own research.
The BANT framework can be useful here. A qualified prospect will have Budget, Authority, Need and Timeline (will they buy any time soon?).
Customer churn rate - A high overall rate, customers may churn to competitors, back to their old solution or back to needing no solution. Additionally, the impact of churn can be determined by the:
Customer Acquisition Cost (CAC) - The amount spent to acquire a customer that is now a lost investment. According to this HBR report, the cost of acquiring customers is typically five to twenty-five times higher than retaining an existing one.
Customer Lifetime Value (LTV) - The future revenue that is now forfeited.
Net Promoter Score (NPS) - A low overall NPS score is a leading indicator of potential churn.
Strong competitors - High-strength competitors or those with a high future threat level. This information is gathered from competitor analysis.
Porter’s Five Forces to consider:
Competitive rivalry is high - You have an increasing risk of churn that will impact your market share due to:
Many alternative offerings.
Competitors have very similar offerings.
Buyers can easily switch.
Slow or stagnant market growth.
High cost to exit the market (therefore, you should do your best to keep your position healthy).
Threat of new entrants is high - This is a future risk impacted by low barriers to entry, including structural and strategic barriers.
Threat of substitutes is high - Where a different type of product can fulfil the same need. For example, when travelling, trains compete with cars and aeroplanes.
Retire the product
In some scenarios, you may decide to remove the product entirely:
Declining market - No signs of recovery.
Competitive pressure - Continual losses despite changes to strategy.
Alternative strategies - Better growth and ROI elsewhere, or no longer aligns with your strategy.
When to select “Reduce costs/cost avoidance”
The following considerations may lead you to prioritise this strategy:
You are struggling with lower-priced competitors, or you are very vulnerable to competitors lowering prices. The picture below demonstrates this. Organisation 3 has deliberately lowered prices, seriously impacting Organisation 2. A simple way to evaluate this is to assess at what price profitability would become an issue. These are scenarios where competitor pricing may impact you:
Existing competitors may drop their overall price.
Existing competitors are typically offering discounts. The price shown is not the usual amount they charge.
New competitors may enter, seeking to differentiate with a low-cost (and low-price) strategy. This can disrupt an existing market where competitors incur high costs.
A new competitor loss-leads to take a section of the market but may not be able to afford this in the long term.

Your product’s overall strategic focus is low costs. This means you are using low costs as a primary differentiator.
There are many standard products with little differentiation, and brand is of low importance.
Cost avoidance - Areas of high cost that are expected in the future. For example, expansion will lead to large, expensive new teams to support manual processes.
Areas of high cost and inefficiency:
An unhealthy Cost Per Unit (CPU) including:
Fixed costs - These are costs that remain constant regardless of factors like the number of customers or usage. This typically applies in the short term, as large changes could increase or decrease them.
Variable costs - These vary depending on the number of customers or usage.
Porter’s Five Forces to consider:
Competitive rivalry is high - More competition increases the risk of competitors joining with a low-cost strategic focus.
Buyer power is high - Buyers will churn if you set your pricing too high, and can even drive down prices.
Bargaining power of suppliers is high - There are few suppliers or high switching costs, leading to them demanding more money.
Retire the product
In some scenarios, you may decide to remove the product entirely:
Low profitability - High level of investment with a continued likelihood of low profitability. You should consider gross profit and gross profit margin metrics.
Major costs - Major costs that can't be reduced. For example, supply chain, labour and infrastructure. See the costs section of the canvas.
Regulations - New regulations, such as legal and compliance, that stop you from being profitable.
When to select a “Growth strategy”
Even if you have prioritised a different strategy, you still may decide to allocate capacity to growth when you have spare capacity to invest. The following considerations may lead you to prioritise this offensive strategy:
Select Increase market share when:
Your strategic focus is differentiation, and you want to strengthen this further.
You have access to many customers who have not used your type of product before.
You have a weak competitor(s) and can take significant market share from them, possibly removing them from the market.
Select New markets/products when:
You have a new market available with access to many customers who have not used your type of product before.
Your current market is becoming saturated or is in decline.
You have unique capabilities you can use to expand.
An emerging trend will disrupt your current business model, or is one you can take advantage of.
You see a significant opportunity for increased profit.
STAGE 3 - Research
With a priority for your strategy set, you are ready to research and create Strategy Items. You can now focus your efforts. For example, you may wish to run trend analysis to see if there are some cost savings options. Alternatively you may be running trend analysis to look for growth opportunities. You may have identified specific problems you want to tackle. For example, you have inefficient data storage and want to do some research on how to bring the cost down.
Gathering evidence your solution will work
The effort required to gather evidence should be balanced against the risk of an item not being prioritised. For example, it may be good enough to get a ballpark cost for a new tool rather than a fully costed solution. Another example would be a lightweight prototype you’ve run past a few customers versus a fully functional one. Consider the potential investment required. If you are going to invest several million pounds in a new product, it would be wise to do up-front research to confirm there is market demand.
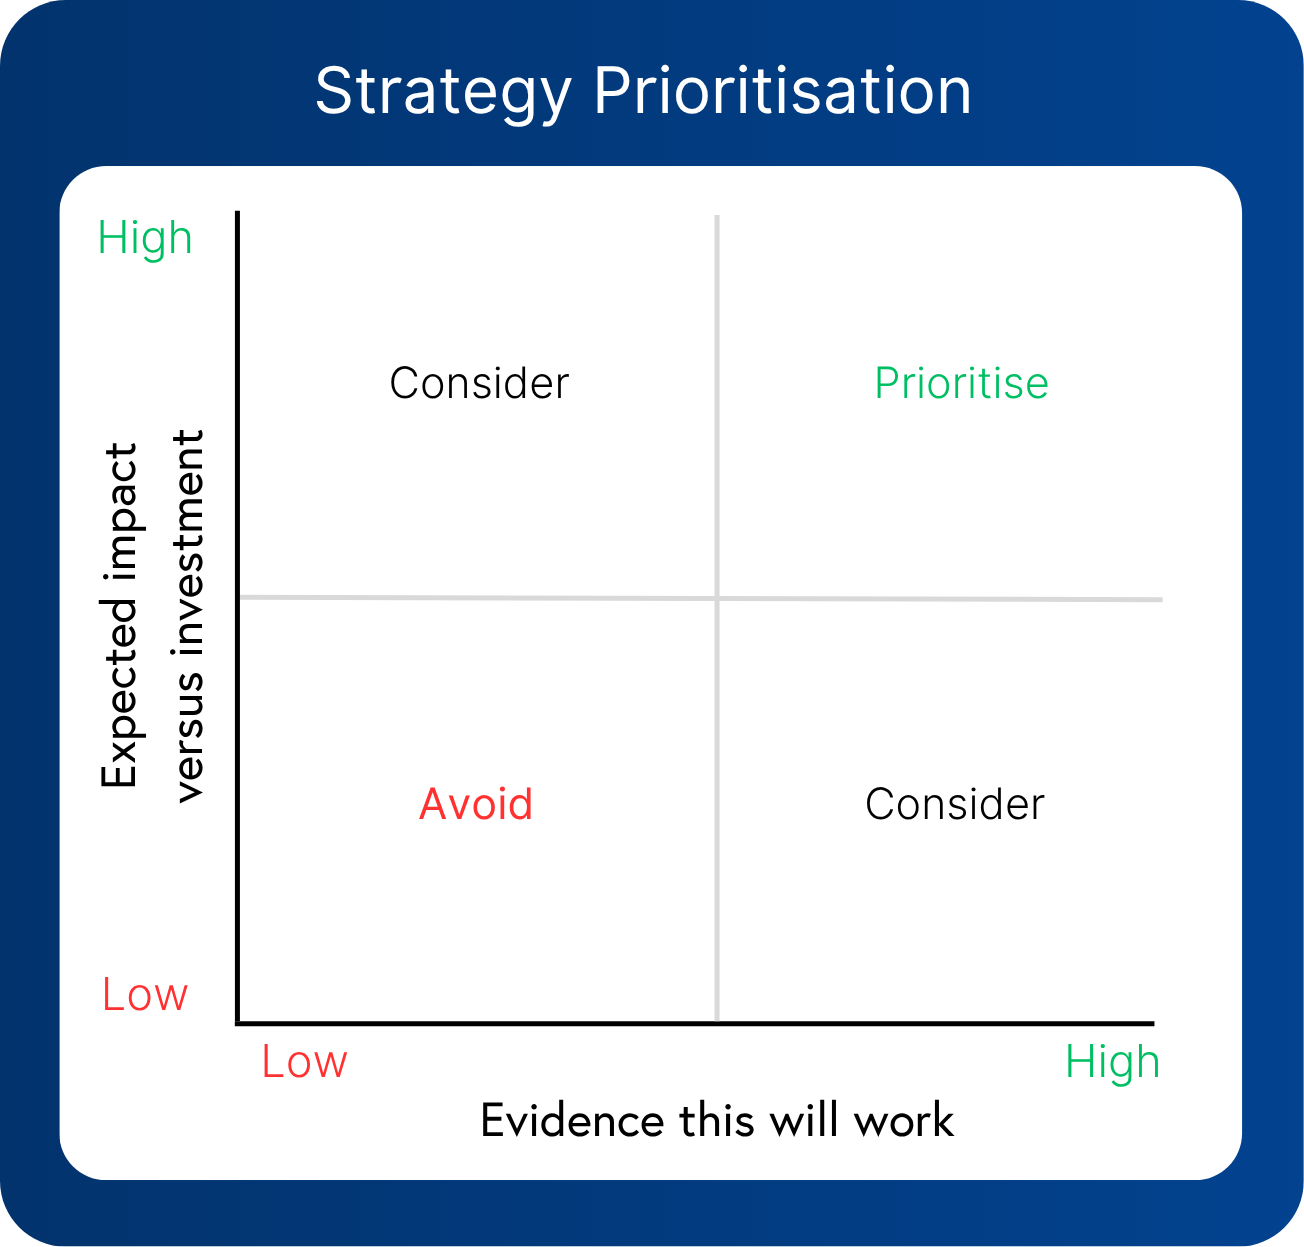
Use the following guide to help you prepare to answer the “Evidence this will work” axis on the grid (see Stage 4. below). If evidence is low in one area, look to de-risk it.
Desirability considerations - Evidence that customers want this:
Evidence that it solves a big enough problem for customers.
Newness or level of differentiation of the solution in the market.
Evidence that customers want your solution and will switch from current solutions.
Feasibility considerations - Evidence that we can build and run this:
Understanding of technical design, including the ability to build it and ensure it will scale to customer demand.
Understanding of service design, including the ability to run it and ensure it will scale to customer demand.
Understanding of any major risks that could lead to this failing or greatly increasing in cost.
Viability considerations - Evidence that this will generate a profit:
Understanding of the pricing model and that the target price point is competitive.
Evidence that customers will pay.
Understanding of costs including build, customer acquisition and running the service.
How long it will take to reach the break-even point and then achieve a good Return on Investment (ROI).
Strategy Items
Strategic Items are lightweight artefacts that provide structure to your solution options. It is important that you read these instructions to create them properly.

Helpful tools
CPF provides the following to help you identify solutions:
Guidance for your prioritised strategic direction - See the relevant page tab.
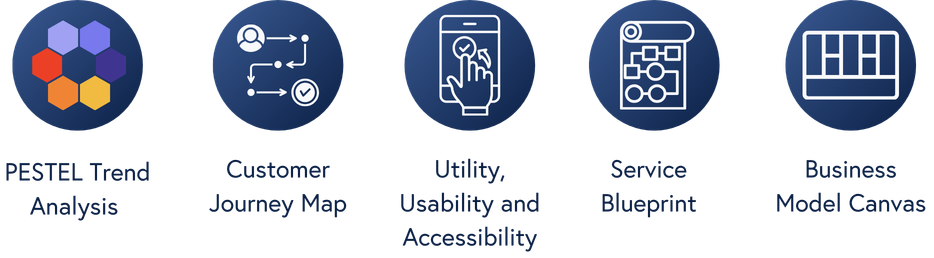
Strategic Discovery Tools - You can augment these based on your needs or ignore them if they are not relevant.
STAGE 4 - Prioritise
Prioritisation is the final stage in which you will decide the strategies to take forward.
Strategic Direction review - Returning to the Field’s Strategic Priority Analyser may be helpful as a reminder of why you prioritised a specific strategic direction.
Present solutions - Those involved in research should now present their Strategy Items and any corresponding research.
Prioritise - Map each Strategy Item onto the grid and discuss it. It can be helpful to colour-code the strategy each supports. For example, making the “reduce costs“ items green. Further guidance for the “Evidence this will work” on the grid is below it.
Assign - Assign Strategy Items to teams. Full instructions are available below the prioritisation grid.
Assigning strategy to teams
Each team should be linked to a strategy. Avoid linking a team to more than one strategy, especially if it creates resource bottlenecks. You can also have multiple teams linked to a single strategy. In this case, it is advisable to have a single owner for each strategy to avoid confusion. This should be someone who is readily available to guide the strategy and make decisions.

Current strategy considerations
Teams may already be working on a strategy. Therefore, these should be reviewed, as you may not want to interrupt them, or you could delay the new strategy until they finish what they are doing. OKR key results can be used to measure progress on their current strategy. If they are ready for something new, make sure you agree which canvas the team(s) should be using:
Strategic Area - Where the product is being incrementally improved. For example, improving the visual design of a feature.
Product Positioning - Provides an in-depth innovation process for new products and high-risk features. For example, adding a reporting engine to a data product.
Option to change delivery team structures
You should consider optimising your delivery team structure where:
You have many interdependencies between teams. This can be particularly bad if you have separate teams based on technologies or capabilities.
You have specific teams or individuals who are involved in multiple strategies.
These dependencies can cause major bottlenecks, high levels of work in progress, and, ultimately, late delivery if not addressed. Keep teams together when they become high-performing. This is much better than resetting all the teams each time you change strategies.
You should cross-train people to remove delivery bottlenecks when these are likely to happen regularly. For example, a database administrator is used by all teams and is regularly blocking them. Where this is not the case, plan carefully around these. Consider removing specialist component teams where there is sufficient work and instead, put these skills into each team. For example, you have a group of user acceptance testers that always cause a bottleneck, and you move one person into each team.
Pricing
Discuss if you need to review pricing based on your new strategy. This process is not included here.
Product profitability
Capturing your overall profitability is essential. It tells you if your product is sustainable and overall will ensure your organisation survives. Gross profit and gross profit margin are metrics that reflect this aspect. You should track trends as well as individual data points. For example, you may have a bad month for sales and, overall, be unsure whether your product is sustainable, which could lead to a poor decision based on a single data point.


Break-even point reached
This is the point at which revenue covers your fixed and variable costs. It is a strong indicator of financial health. Even established organisations may struggle to break even as they grow and costs increase.
When expected to break even
Ideally, your revenue will be increasing, or you will be focusing on bringing costs down. This is not always just for new products. You may be experiencing new higher costs or intense market competition.