



Define your strategy and the results you expect
Strategic Area
Overview
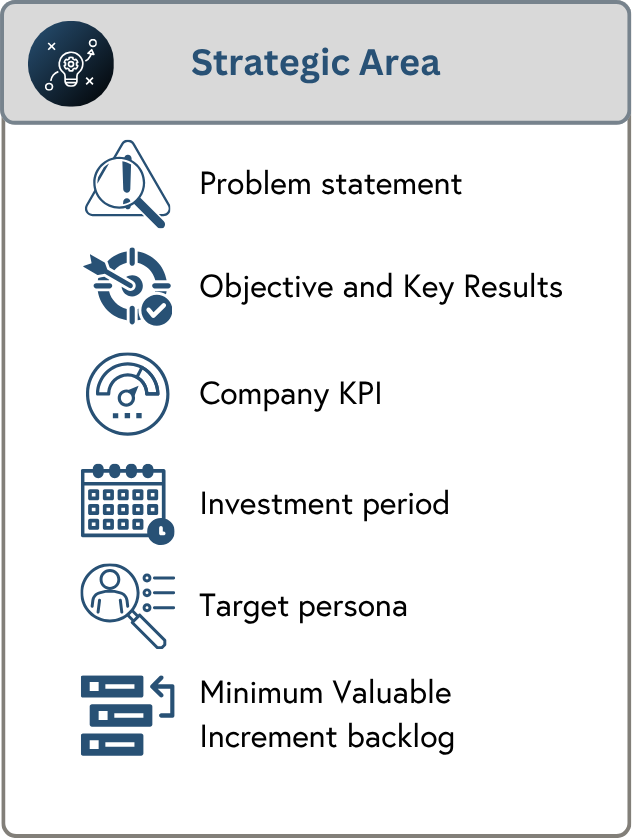
The Strategic Area is used for incremental improvements to an existing product. If you are creating a new product or paid feature, use the canvas from the Product Positioning stage.
It can be tempting to jump straight into small units of deliverable value (known as Minimum Valuable Increments in the framework). Although releasing value early and often is desirable, it can be hard to see the impact of these. Additionally, lacking a clear strategy can be wasteful when you spread your efforts across many areas and don’t make a noticeable impact anywhere. The Strategic Area is designed to give a medium-term view.
Feedback loops

As you release each MVI, depending on the results, you should evaluate your strategy:
Stop - The strategy isn’t working, the results are too poor, and you cannot fix it
Pivot - The strategy is sound, but the approach needs to be changed
Continue - The strategy is working well, you may even decide to invest more in it
Tracking progress with leading indicators
Consider this progress-tracking example. The Net Promoter Score (NPS), a score that measures customer satisfaction, is low. One of the main causes of this is poor error handling. For our strategy, we have identified 20 high-impact errors that were poorly handled and decided to make them easier to understand. It will take a lot of these fixes to improve the NPS score. After three months, we seek feedback and find the new error message format hasn’t been well received. The strategy has failed. Tracking leading indicators in each MVI could have helped us see this earlier:
A leading indicator is a predictive measure
Each MVI fixes one or two error messages and can be released independently. For each MVI, we track the number of calls to the helpdesk regarding the particular errors. We can predict that if each MVI reduces the number of calls, with enough of these fixes, we will see a change in the overall NPS score. As the results come in, we find that the number of calls has not changed. We can tell very quickly that the strategy isn’t working.
A lagging indicator is the final result
In the Strategic Area, we track the NPS Score. We will measure this every three months to see the cumulative effect of our changes. This is the result we care about. We don’t want to measure the NPS score every time an MVI is released as it’ll annoy customers, is too much effort and, with small changes, is unlikely to change.
Strategic Area Canvas
This canvas will help you structure your Strategic Area. Detailed instructions are provided below it.
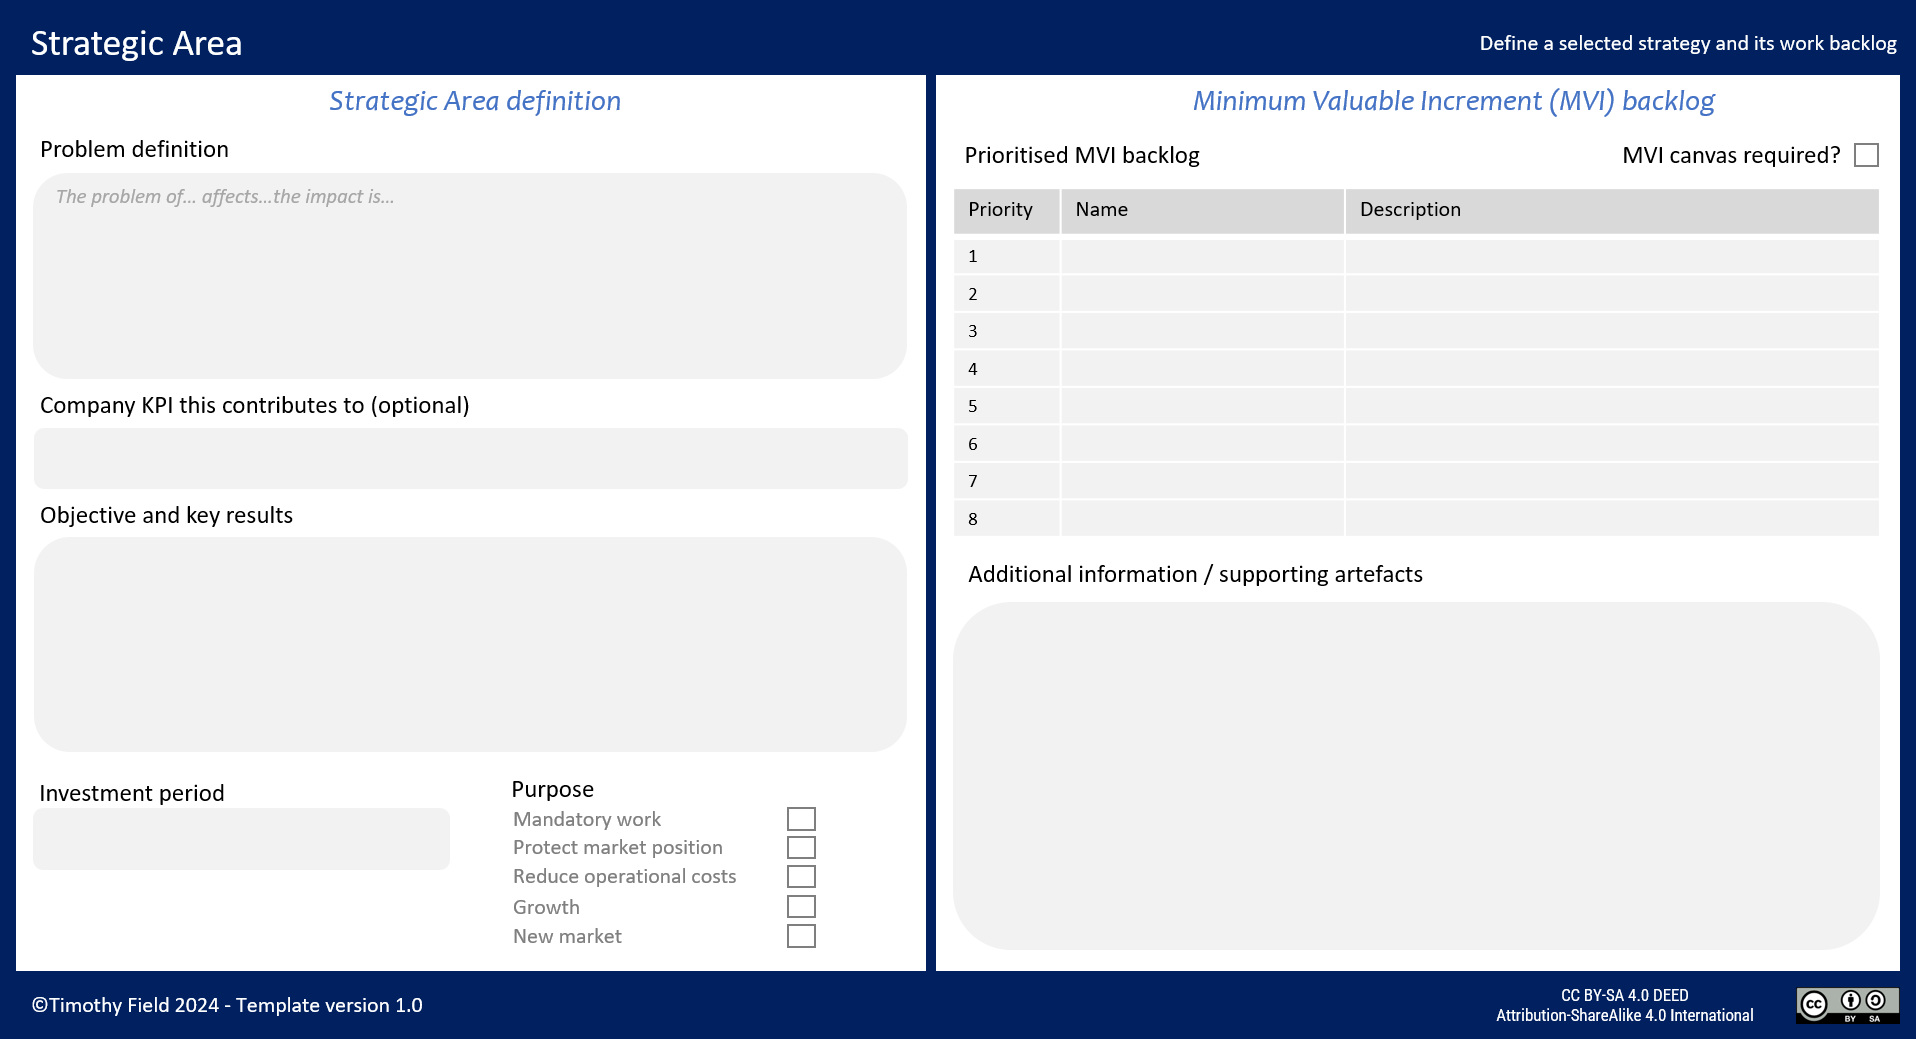
Feel free to recreate the canvas in a tool of your choice. Please attribute the author (Timothy Field), the source of the canvas (this webpage) and add the CreativeCommons BY-SA license
Canvas guide
Problem definition
Using the problem statement format
The problem of [description]
Affects [customer profile]
The impact is [ideally quantified]
The problem that this strategy solves. This should be based on research rather than assumption. If this change is customer-focused, then the problem statement should reflect what customers are experiencing rather than what people assume they are experiencing. In other words, don’t assume someone has a major issue, you should go and check.
The impact of the problem is very important, and should ideally be quantified. Quantification is also a good indicator of the strength of evidence you have. This can serve as the baseline for the results you aim to achieve.
In some cases, you are targeting all your Ideal Customer Profile (ICP) and the “Affects” line will not be particularly useful. It helps if you are targeting a subset of people/organisations with this strategy. For example, you are providing a feature at a subset of enterprise-scale customers. The Ideal Customer Profile (ICP) is defined in the Product Positioning stage.
Company KPI (optional)
Linking this strategy to a company KPI can provide an overall reason for it. For example, you are improving your Net Promoter Score (NPS), a measure of customer satisfaction. In some cases, you can make a direct, measurable impact to these KPIs. For example, you reduce the run costs of your database hosting by half. In some cases, you can’t. For example, many different activities are going on to increase sales, and you won’t be able to see how much yours has made a difference.
Objectives and Key Results
Using the OKR format
Objective - a single sentence that summarises your strategy
Key Result - From [X] to [Y] by [Z] date (committed / stretch)
The objective should be an easy-to-understand sentence that sums up your strategy. Key Results can be “committed” where outcomes are guaranteed or “stretched” if they cannot be. An example of a stretch target would be increased sales. You cannot guarantee what a customer will do.
Work purpose
What is this strategy for?
Mandatory work - Keep the lights on, legal, regulatory and compliance work.
Reduce costs - Remain competitive, increase profitability
Protect market position - Reduce customer churn, sales loss. This includes major future risks to these.
Increase market share - Win customers who are new to the solution type. Take more from weak competitors.
New market - This is where you target a new customer group.
Note: There is no option for a new product here (includes paid features). If you are doing this, you should use the Product Positioning canvas.
You can prioritise one of more of these in the Strategic Direction stage.
Investment period
If high-level estimates are possible, then use these. In most cases, you won’t have these, and an investment period reflects this reality. Additionally, strategy usually requires testing and learning to achieve the expected outcomes (OKRs). This is very hard to estimate. Where this is the case, you have an investment period to be clear on how much time you are prepared to spend on this before re-evaluating.
MVI canvas required
In the Minimum Valuable Increment stage, an MVI canvas is provided to structure how you build and measure results. This checkbox indicates whether you have decided to use it. The MVI canvas is strongly recommended when:
The work is exploratory, and a lot of testing and learning is required.
There are several MVIs required before it is possible to measure the Strategic Area results. This is especially important if each MVI will take a long time.
You may not find the canvas helpful if you don’t meet these criteria. You should build the work and track the Strategic Area results at an appropriate time.
Prioritised MVI backlog
A backlog of work items that the delivery teams will work on. These MVIs are released independently, and their order can change based on feedback. A description is provided in the grid to help explain how the strategy will be built incrementally.
Additional information/supporting artefacts
This is a brief summary of important information meant as an executive summary. You may link to external artefacts if you need additional detail.